

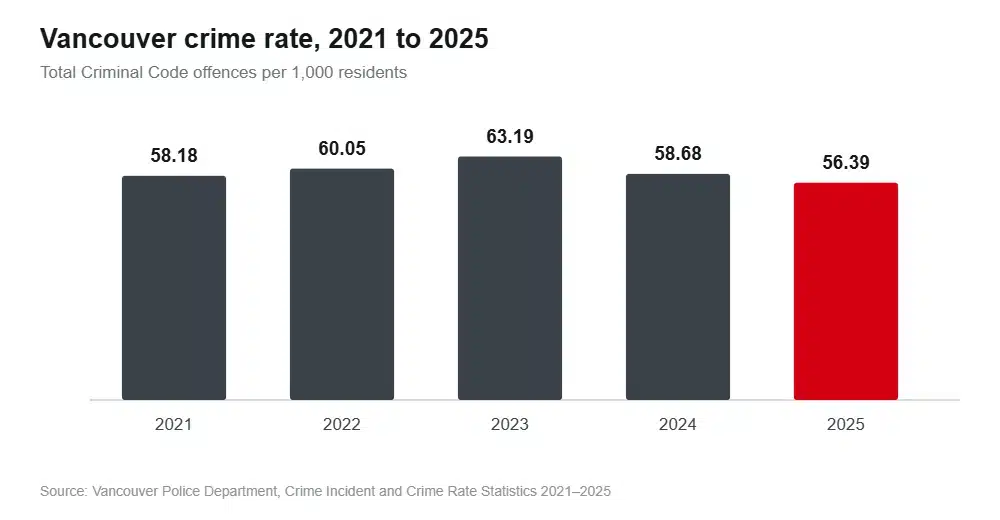
Vancouver records fewer crimes per resident today than it did three years ago, and the drop is not small. The city’s total Criminal Code rate fell from 63.19 offences per 1,000 people in 2023 to 56.39 in 2025, according to the Vancouver Police Department’s own year-end tables. The violent-crime rate fell faster still, down about 17 per cent over the same two years.
None of which will convince anyone who has walked past a tent on Hastings Street or come back to a car with the window smashed. So this guide does something different from most “is Vancouver safe” pages. It shows you the actual numbers, neighbourhood by neighbourhood, and it is honest about the two things those numbers do badly.
The short version
- Vancouver’s crime rate is falling, and 2025 was the lowest year in the current five-year series.
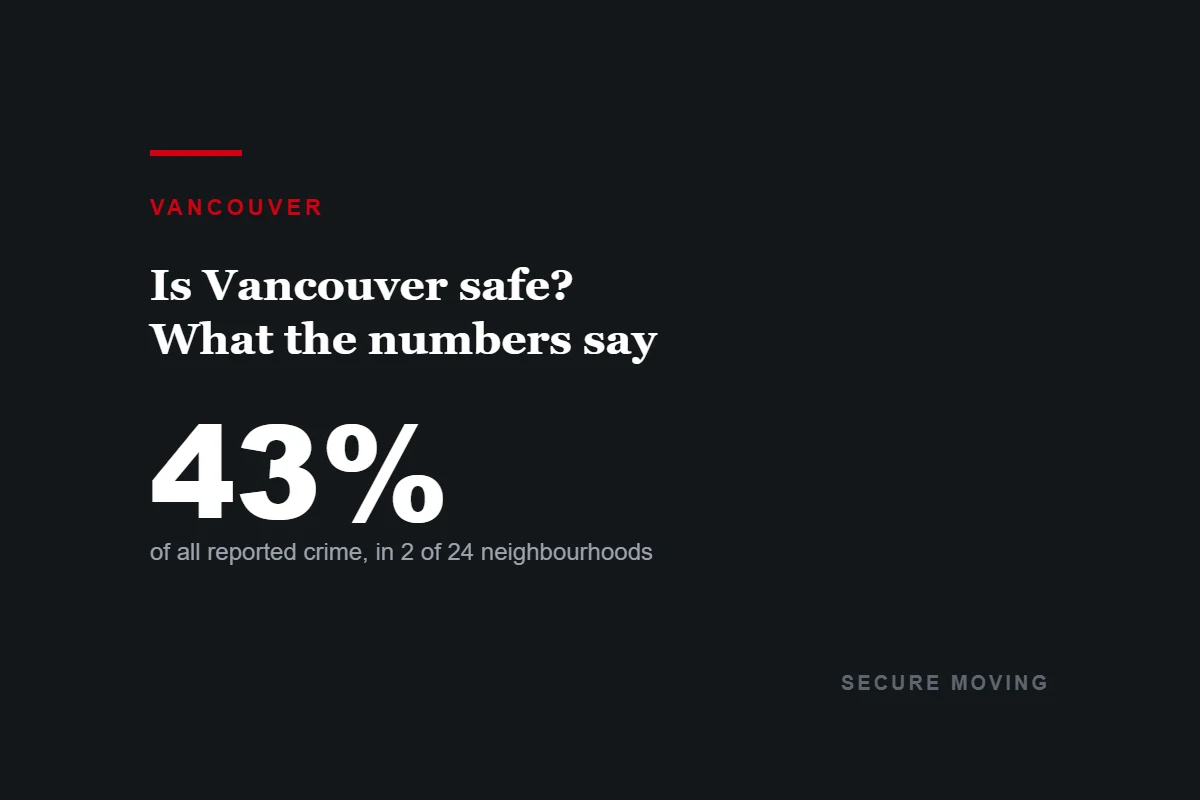
- Violent crime is heavily concentrated. Two of the city’s 24 police-reporting neighbourhoods account for 43 per cent of all reported offences and 78 per cent of weapons offences.
- Property crime, not violence, is what most residents will actually experience. Theft from a parked vehicle was reported 5,385 times in 2025.
- Shoplifting and weapons offences are the two categories moving the wrong way.
- Homicides rose sharply in 2025, from 11 to 26, off a very small base.
What happened to crime in Vancouver, 2021 to 2025
The VPD publishes counts and rates for every year. Here it is over five years, with rates expressed per 1,000 residents.
| Rate per 1,000 | 2021 | 2022 | 2023 | 2024 | 2025 |
|---|---|---|---|---|---|
| Total Criminal Code | 58.18 | 60.05 | 63.19 | 58.68 | 56.39 |
| Violent crime | 8.49 | 8.64 | 8.58 | 8.06 | 7.09 |
| Assaults | 6.70 | 6.74 | 6.74 | 6.24 | 5.50 |
| Robbery | 0.82 | 0.95 | 0.84 | 0.87 | 0.65 |
| Property crime | 41.51 | 43.63 | 46.18 | 42.04 | 40.67 |
| Break and enter, residence | 1.11 | 1.05 | 1.03 | 0.86 | 0.73 |
| Theft from a vehicle | 10.29 | 9.90 | 9.81 | 7.89 | 7.16 |
| Theft under $5,000 | 13.10 | 15.55 | 17.13 | 17.79 | 17.68 |
| Offensive weapons | 1.14 | 0.87 | 1.01 | 1.14 | 1.62 |
Source: Vancouver Police Department, Crime Incident and Crime Rate Statistics 2021–2025. Rates use the City of Vancouver planning population, which was 753,100 for 2025.
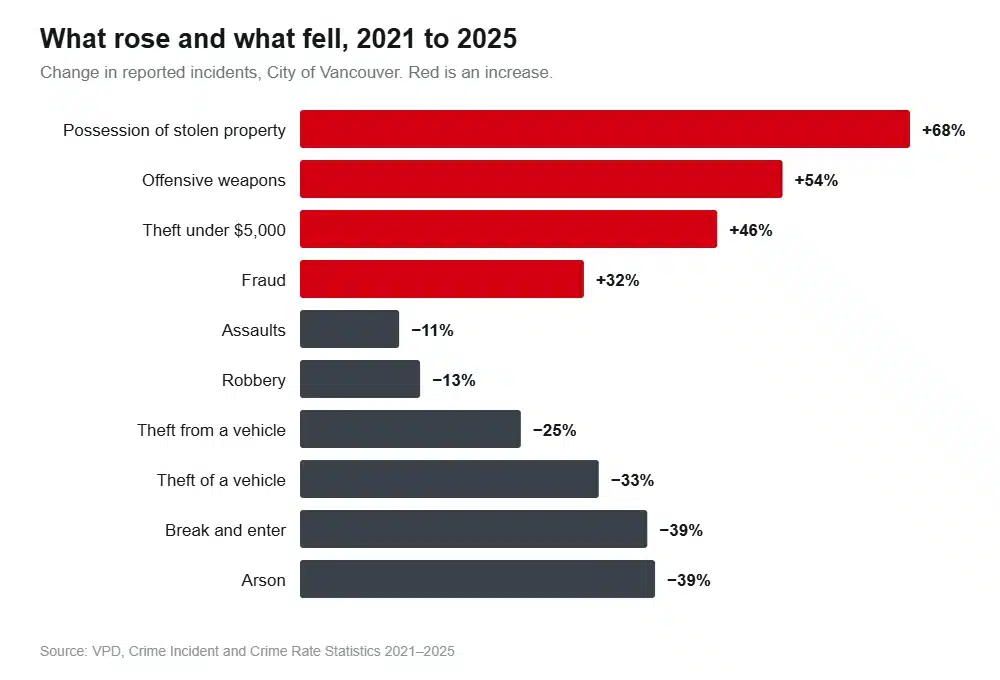
Read down the columns and a pattern shows up. Almost everything a person is frightened of has fallen. Break-ins at homes are down 29 per cent in four years. Car theft is down a third. Robbery had its lowest year of the five.
Two lines run the other way, and they are the ones worth paying attention to.
Theft under $5,000 is now the single largest crime category
At 13,317 incidents in 2025, petty theft accounts for almost a third of every crime reported in Vancouver. The count has risen 46 per cent since 2021. This is mostly retail theft, and it is a national story rather than a Vancouver one: Statistics Canada recorded shoplifting up 11 per cent across the country in 2025, one of the very few categories that rose while everything else fell.
It is also the reason the headline “crime rate” looks worse than the city feels. Strip shoplifting out and the trend line drops more steeply still.
Weapons offences and homicide both rose
Offensive weapons charges climbed from 794 in 2021 to 1,220 in 2025, a 54 per cent increase. Homicides went from 11 in 2024 to 26 in 2025. That second number deserves care. Vancouver is a city of roughly 750,000 people, so a swing of 15 cases moves the rate from 0.01 to 0.03 per 1,000, and single-year homicide counts bounce around for reasons that have nothing to do with a trend. The five-year run reads 18, 13, 15, 11, 26. Anyone presenting 2025 as proof of a collapse in public safety is reading noise as signal, and anyone dismissing it entirely is doing the same thing in reverse.
Where the crime actually is
This is the part that gets left out, and it changes the answer completely.
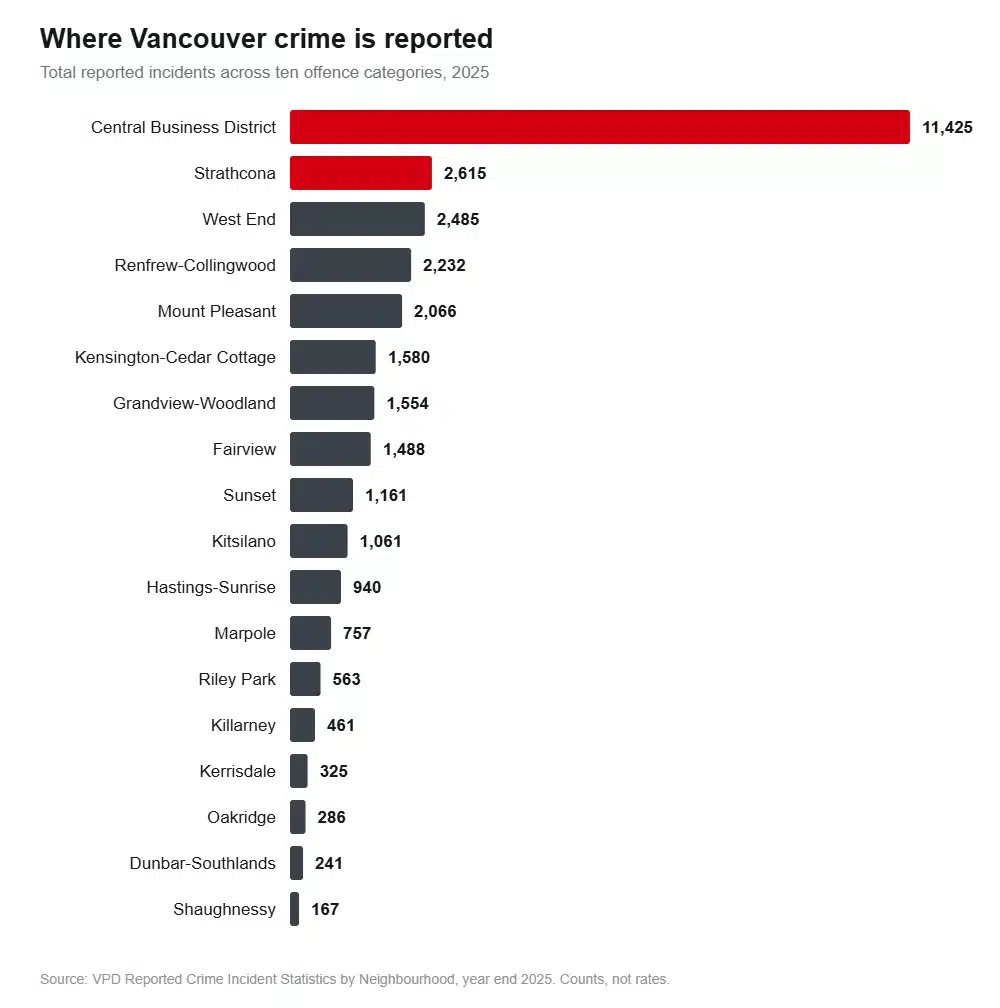
The VPD breaks reported incidents down by neighbourhood. Below is 2025 in full, ranked by total reported offences across the ten categories the department publishes.
| Neighbourhood | Assaults | Robbery | Break & enter | Theft from auto | Weapons | All 10 categories |
|---|---|---|---|---|---|---|
| Central Business District | 1,591 | 218 | 438 | 1,855 | 708 | 11,425 |
| Strathcona | 622 | 64 | 151 | 369 | 244 | 2,615 |
| West End | 306 | 35 | 149 | 443 | 38 | 2,485 |
| Renfrew-Collingwood | 168 | 22 | 123 | 202 | 9 | 2,232 |
| Mount Pleasant | 215 | 36 | 173 | 220 | 39 | 2,066 |
| Kensington-Cedar Cottage | 185 | 26 | 127 | 317 | 25 | 1,580 |
| Grandview-Woodland | 254 | 22 | 121 | 219 | 44 | 1,554 |
| Fairview | 115 | 9 | 164 | 219 | 28 | 1,488 |
| Sunset | 80 | 9 | 77 | 148 | 9 | 1,161 |
| Kitsilano | 101 | 10 | 92 | 202 | 10 | 1,061 |
| Hastings-Sunrise | 97 | 7 | 84 | 222 | 9 | 940 |
| Marpole | 69 | 4 | 89 | 146 | 8 | 757 |
| Riley Park | 41 | 3 | 75 | 148 | 2 | 563 |
| Victoria-Fraserview | 45 | 9 | 29 | 136 | 10 | 481 |
| Killarney | 51 | 3 | 37 | 84 | 5 | 461 |
| Kerrisdale | 22 | 3 | 29 | 73 | 5 | 325 |
| South Cambie | 24 | 2 | 33 | 56 | 4 | 322 |
| Oakridge | 26 | 0 | 44 | 56 | 1 | 286 |
| Dunbar-Southlands | 22 | 0 | 24 | 72 | 4 | 241 |
| West Point Grey | 24 | 2 | 29 | 60 | 3 | 236 |
| Arbutus Ridge | 18 | 1 | 25 | 41 | 4 | 200 |
| Shaughnessy | 15 | 2 | 32 | 43 | 3 | 167 |
| Stanley Park | 18 | 4 | 12 | 54 | 4 | 166 |
| Musqueam | 15 | 0 | 0 | 0 | 0 | 24 |
Source: VPD Reported Crime Incident Statistics by Neighbourhood, year end 2025. The ten categories are sexual offences, assaults, robbery, break and enter, theft of vehicle, theft from auto, theft under and over $5,000, arson, mischief and offensive weapons.
Two neighbourhoods, nearly half the crime
The Central Business District and Strathcona together produced 43 per cent of all reported offences in a city with 24 reporting areas. Look at the violent categories and the concentration gets sharper still:
- Assaults: 2,213 of 4,124 city-wide, or 54 per cent
- Robbery: 282 of 491, or 57 per cent
- Weapons offences: 952 of 1,216, or 78 per cent
Strathcona is the police-reporting area that contains most of the Downtown Eastside. Nobody who lives here needs a table to know that. What the table adds is scale: the rest of Vancouver, meaning 22 of 24 neighbourhoods and the large majority of its residents, reported 1,911 assaults across the whole of 2025.
Dunbar-Southlands recorded 22 assaults and zero robberies all year. Arbutus Ridge recorded 18 assaults and one robbery. Kerrisdale, 22 and three.
The one thing this table cannot tell you
These are counts, not rates, and the Central Business District is where the distinction matters most. Downtown has a resident population in the tens of thousands and a daytime population several times larger, made up of commuters, shoppers, tourists, transit passengers and people coming in for a night out. Dividing downtown’s crime count by its residents would produce a rate that is close to meaningless.
The same problem, in a milder form, applies to Stanley Park. Almost nobody lives there. Its 166 reported offences happened to visitors, mostly to their parked cars.
So use the table for what it is good at, which is showing you where incidents happen, and be careful about turning it into a per-person risk figure for anybody.
How Vancouver compares
Two different measures answer this, and they answer slightly different questions.
The Crime Severity Index weights offences by seriousness, so a homicide counts for far more than a bike theft. Statistics Canada reported a 2025 CSI of 83.5 for the Vancouver census metropolitan area, against a national figure of 75.0. Vancouver sits above the Canadian average and below the British Columbia average of 92.4. Among BC’s metro areas it is the second lowest, behind Victoria at 74.6, and well under Chilliwack at 134.3, Kamloops at 126.2 and Kelowna at 103.7.
One caution here. The Vancouver CMA covers all of Metro Vancouver, from Bowen Island to Langley, so it is not a measure of the City of Vancouver.
For city-level comparison, the province’s Police Resources in British Columbia, 2024 gives Criminal Code offences per 1,000 residents by municipality:
| Municipality | Offences per 1,000 (2024) |
|---|---|
| Port Moody | 29.2 |
| North Vancouver District | 31.9 |
| Delta | 33.9 |
| Coquitlam | 43.2 |
| West Vancouver | 47.2 |
| Surrey | 52.5 |
| Richmond | 56.8 |
| Burnaby | 57.2 |
| Vancouver | 60.4 |
| New Westminster | 60.8 |
| Maple Ridge | 64.0 |
| North Vancouver City | 66.7 |
| Mission | 96.7 |
| Chilliwack | 115.7 |
Vancouver at 60.4 sits in the middle of its own region and comfortably below the provincial municipal average of 81. A city hosting the province’s entertainment district, its main transit hub, its cruise terminal and its most concentrated area of street homelessness does not carry an unusual crime rate for British Columbia.
What you are actually likely to experience
Here is the risk profile, in plain order of likelihood.
Something taken from your car. With 5,385 incidents in 2025, this is far and away the most common crime that touches an ordinary resident, and it happens everywhere. Kitsilano logged 202, Riley Park 148, Dunbar-Southlands 72. The rate has fallen 30 per cent since 2021, and it is still the thing most likely to happen to you.
A package or a bike taken. Petty theft is the largest single category in the city and it is not confined to any district.
A break-in. Homes were broken into 546 times across the entire city in 2025. Against roughly 305,000 households, that works out to fewer than two per 1,000 homes in a year.
Violence. Statistically unlikely outside a small number of settings, and heavily concentrated in the two neighbourhoods above. Most assaults in Canada happen between people who know each other, and street violence involving a stranger is rarer still.
The Downtown Eastside question
Any honest guide has to address this directly, because it is the single image that shapes Vancouver’s reputation.
The area centred on Main and Hastings has the highest concentration of visible poverty, addiction and untreated mental illness of any few blocks in Canada. Walking through it is confronting. It also produces a large share of the city’s reported violence, as the Strathcona row in the table above shows.
Two things are true alongside that. The violence is overwhelmingly among people living in the area rather than directed at passers-by. And it covers a small geographic footprint: the DTES is walkable end to end in about fifteen minutes, and the neighbourhoods immediately around it, including Gastown, Chinatown and the eastern edge of downtown, look and feel very different a few blocks in any direction.
People move into Strathcona, Chinatown and Railtown every month and stay for years. Others find it too much. Both reactions are reasonable, and the only reliable way to work out which one is yours is to walk the specific blocks you are considering, at the times of day you would actually be there.
Frequently asked questions
Is downtown Vancouver safe at night?
Downtown carries the city’s highest incident counts, driven by the entertainment district on Granville Street and the volume of people passing through. Standard urban judgment covers most of it: the well-lit, busy parts of downtown are actively safe, and the risk profile changes on quiet side streets after 2am when the bars empty. Note the theft-from-auto figure of 1,855 downtown incidents. Leave nothing visible in a parked car.
What are the safest neighbourhoods in Vancouver?
By reported incident counts in 2025, the lowest were Musqueam, Stanley Park, Shaughnessy, Arbutus Ridge, West Point Grey, Dunbar-Southlands and Oakridge. The west-side residential areas dominate that list, though they are also the least dense and the most expensive, so the ranking partly reflects how few people and businesses are in them.
Is East Vancouver safe?
East Vancouver is not one place. Renfrew-Collingwood, Kensington-Cedar Cottage, Hastings-Sunrise, Killarney and Victoria-Fraserview all sit in the middle or lower half of the table, with violent-crime counts a fraction of downtown’s. Grandview-Woodland around Commercial Drive runs higher on assaults at 254, reflecting a dense strip of bars and restaurants. Strathcona is the outlier and is a different case for the reasons above. Our neighbourhood guide covers what each of these areas is like to live in day to day.
Is Vancouver safe for tourists?
Yes, with the same caveat every large city carries. Property crime in tourist areas is the real exposure. Stanley Park’s 54 thefts from vehicles are almost entirely visitors’ rental cars left with bags inside.
Is Vancouver’s crime rate getting worse?
Not on the citywide numbers. Total Criminal Code offences per 1,000 residents fell from 63.19 in 2023 to 56.39 in 2025. Retail theft and weapons offences rose over that period, and homicides rose in 2025 off a low base.
How we put this together
Every figure on this page comes from a police or government source, linked at the point of use. We have used counts where the source publishes counts and rates where the source publishes rates, and we have not calculated neighbourhood-level rates, because reliable neighbourhood population figures matched to VPD’s reporting areas are not published and the daytime-population problem downtown would make any such rate misleading.
Two limits are worth stating. Police-reported crime measures what gets reported to police, and reporting rates differ by offence type: car break-ins are often reported for insurance while minor assaults frequently are not. And VPD’s rate calculations use a City of Vancouver planning population of 753,100 for 2025, which is higher than the 2021 census count of 662,248, because it estimates current residents rather than counting them on census day.
Sources
- VPD, Crime Incident and Crime Rate Statistics 2021–2025
- VPD, Reported Crime Incident Statistics by Neighbourhood, year end 2025
- VPD, Reported Crime Incident Statistics by District, 2024 vs 2025
- VPD, Crime Statistics (monthly releases)
- Statistics Canada, Crime Severity Index and crime rate by census metropolitan area, 2025
- Statistics Canada, Police-reported crime statistics in Canada, 2025
- BC Ministry of Public Safety, Police Resources in British Columbia, 2024
- City of Vancouver, 2021 Census population and dwelling counts
Across the inlet the picture splits in two: the City and District of North Vancouver record rates that differ by a factor of two.
Crime numbers only get you so far when the real question is which part of the city to live in. Our rundown of 22 Vancouver neighbourhoods goes through what each one is actually like day to day, and we run crews into downtown, the east side, south Vancouver and Kitsilano most weeks of the year.
If you have read this far because you are weighing up a specific neighbourhood, the practical next step is walking it. It also helps to know what a month in Vancouver actually costs, and how the city sits against the rest of the province on crime. Once you have settled on an address, tell us where you are moving from.
