

Ask whether North Vancouver is safe and you have already made the mistake almost every article on the subject makes. There is no single North Vancouver. There are two municipalities sharing a name, a mountain range and one RCMP detachment, and in 2024 one of them recorded more than twice the crime rate of the other.
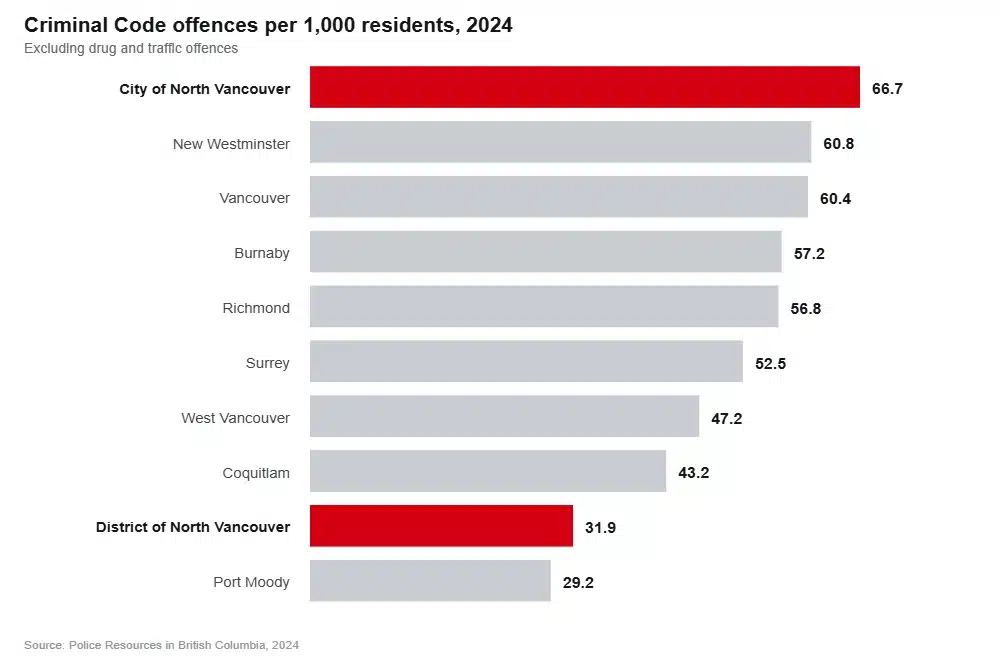
That year the City of North Vancouver logged 66.7 Criminal Code offences per 1,000 residents. Its neighbour logged 31.9. Both numbers come from the same page of the same provincial report. If someone quotes you a crime rate for “North Vancouver” without saying which one, they are averaging two very different places.
The short version
- The District of North Vancouver is one of the lowest-crime municipalities in Metro Vancouver. Only Port Moody came in lower among the region’s larger municipalities in 2024.
- Recorded crime in the City runs higher than in Vancouver, Burnaby, Richmond or New Westminster. That sounds alarming and mostly is not.
- The gap between them is driven less by violence or theft than by the category police call “other Criminal Code” offences: mischief, breaches, disturbances. A dense downtown with a nightlife strip generates those.
- Crime fell in both places in 2024, by 2.8 per cent in the City and 8.7 per cent in the District.
- Your realistic risk in North Vancouver is your car getting broken into at a trailhead, and your realistic hazard is the road, not a stranger.
Two North Vancouvers, one name
The City is the dense bit: roughly 68,000 people packed into 12 square kilometres around the Lonsdale corridor, from the SeaBus terminal up the hill. Wrapping around it on three sides, the District holds about 102,000 people across 160 square kilometres of Lynn Valley, Deep Cove, Edgemont, Blueridge and the Seymour area. One is a walkable small city. The other is a set of mountain suburbs.
They are policed by a single RCMP detachment, but the province reports them separately, and the difference is stark.
| 2024 | City of North Vancouver | District of North Vancouver |
|---|---|---|
| Population | 67,977 | 102,285 |
| Criminal Code offences | 4,535 | 3,262 |
| Rate per 1,000 | 66.7 | 31.9 |
| Authorized officers | 68 | 87 |
| Residents per officer | 988 | 1,176 |
| Policing cost per resident | $290 | $223 |
Source: Police Resources in British Columbia, 2024, published December 2025. The report prints the rates rounded to 67 and 32; the decimals above are what its own count and population columns produce.
One footnote most people miss. The province also reports a third unit, “North Vancouver Prov”, covering unincorporated land inside the same detachment boundary. It runs a few hundred offences a year. So a figure labelled simply “North Vancouver” can mean any of three things.
What that gap really measures
A rate twice as high sounds like a place twice as dangerous. The composition says otherwise.
The province’s most recent breakdown by offence type covers 2023. In that year the City recorded 758 violent offences and 1,822 property offences out of 4,664 total, leaving 2,084 in the residual category that covers mischief, breach of conditions, disturbing the peace and similar. That residual was 44.7 per cent of everything reported. Across the District it was 36.9 per cent.
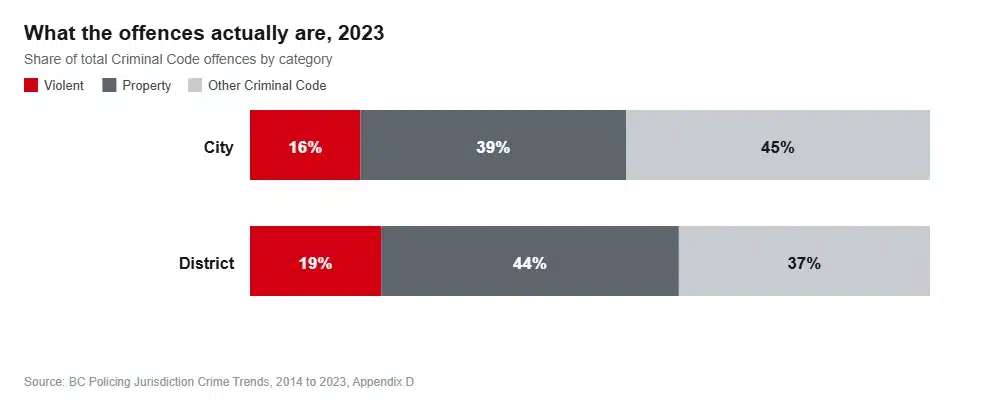
Run it per resident and the pattern holds. Violent and property offences are each roughly 1.7 times as common per head in the City. The residual is roughly 2.4 times as common. What separates the two North Vancouvers is disorder, and disorder is what you get when you put bars, a transit terminal and 68,000 people into 12 square kilometres.
That is not a reason to dismiss the City’s number. If you live above a busy stretch of Lonsdale you will hear things at 1am that Edgemont will not. It is a reason not to read it as a danger rating.
The direction of travel
Both places got safer in 2024. City offences fell from 4,664 to 4,535 and the rate from 71.4 to 66.7. District offences fell from 3,571 to 3,262 and the rate from 36.0 to 31.9. The wider Vancouver census metropolitan area saw its Crime Severity Index drop 8 per cent in the same year, so the North Shore was riding a regional trend rather than bucking one.
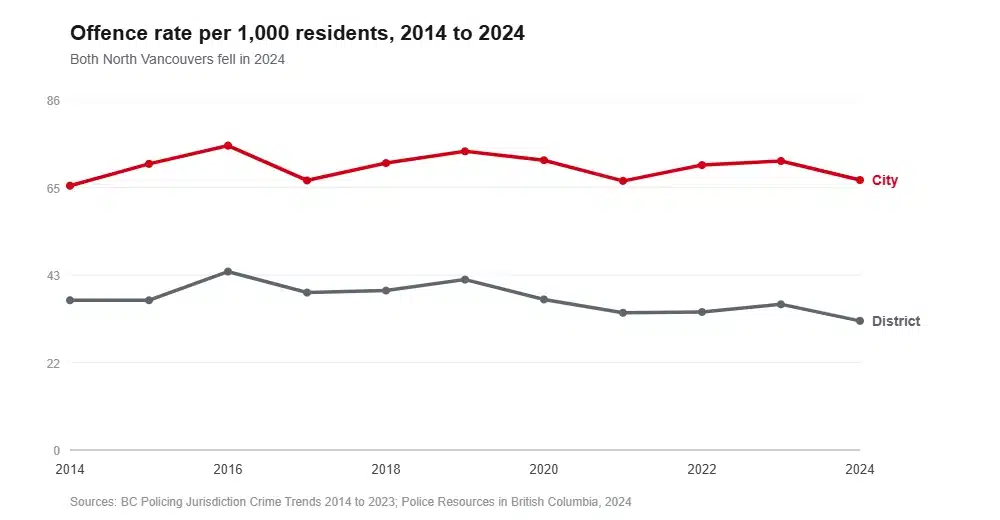
Look at the decade and the two lines behave differently. The City’s total offence count rose about a third between 2014 and 2023, while the District’s fell six per cent. In raw counts the District actually reported more property crime than the City every year from 2014 through 2020, which is what happens when you have 50 per cent more people spread over 13 times the land.
One caution the province itself prints: scoring rules changed on 1 January 2019, so comparisons that straddle that date are not clean. District violent offences appear to have nearly doubled between 2014 and 2023. Measured from 2019 instead, the rise is 24 per cent.
What you are actually likely to experience
Theft from a parked car, and North Vancouver has a specific version of it: trailhead parking.
The last time the RCMP presented detailed numbers publicly was a 2018 briefing to District council. Over the first ten months of that year the District recorded 1,069 thefts from motor vehicles, against 176 residential break-ins and 175 business break-ins. Theft from vehicles was more than three times every break-in combined, and it was rising while burglary and auto theft fell.
That briefing is eight years old, and it is the most granular police data North Vancouver has published. The detachment runs no crime map, issues no quarterly statistics and names no hotspots, not even on its own auto crime awareness page. Anyone showing you break-in counts for Quarry Rock or the Lynn Canyon lot is making them up.
The province-wide context cuts the other way, though. ICBC’s ten-year series has vehicle break-ins across BC falling from 30,342 in 2016 to 12,118 in 2025, a drop of 60 per cent. Trailhead theft is a real North Shore nuisance. Nothing in the published data makes it a worsening crisis.
Practical version: park at Lynn Headwaters or Deep Cove with nothing visible, and take the bag with you rather than moving it to the boot in the parking lot.
The risk nobody puts in the headline
The City published a road safety strategy in 2020 built on seven years of ICBC and RCMP collision data. Its findings are more useful to somebody choosing a neighbourhood than any crime rate.
Roughly 1,800 collisions a year happen on City streets. About ten of them each year cause a serious injury or a death. Over two-thirds happen at intersections. And in recent years, people walking or cycling have accounted for nearly all the fatalities. The corridors carrying the most collisions are Lonsdale, Esplanade, 3rd Street, Marine Drive, St George’s and Fell.
ICBC’s intersection data points the same way. For the year to 30 June 2024, Main Street at the Dollarton Highway ramps recorded 230 crashes, tenth worst in the Lower Mainland. The 2022 list has Capilano Road at Marine Drive on 130, the Ironworkers Memorial Bridge on 122 and Bowser Avenue at Capilano Road on 104.
Every one of those is a highway ramp or a bridge approach. North Vancouver’s crash risk sits exactly where Highway 1, the Ironworkers and the Upper Levels ramps meet ordinary streets, which is the driving a new resident does every single day.
Bears, and the rule you will get fined for breaking
North Vancouver is bear country in a way that surprises people who move from elsewhere in Metro Vancouver. The North Shore Black Bear Society logged 1,405 bear sighting reports across the North Shore in its 2021 to 2022 reporting year, 560 of them in the District. Garbage and organics accounted for 46 per cent of them.
The good news is that this is a managed problem rather than a growing one. The Conservation Officer Service killed three bears in North Vancouver in 2025 and two in 2024, against a provincial total that fell from 603 in 2023 to 303 in 2024.
The part worth writing on your calendar: District of North Vancouver bylaw 8436 says carts go to the curb no earlier than 5:30am on collection day and come off it by 9pm the same day. No night-before set-out. Failing to store attractants where wildlife cannot reach them carries a $500 fine, and there are $250 to $300 fines for fallen fruit, dirty barbecues, unmanaged compost and bird feeders.
Advice is what the City offers on its website. Next door there is a bylaw with numbers in it. Moving into Lynn Valley, Deep Cove or anywhere near the forest edge? That 5:30am rule is the single most useful sentence in this article.
Why it can feel less safe than the numbers say
The 2025 regional homeless count found 168 people on the North Shore, exactly the same as 2023, while the Greater Vancouver total rose 9 per cent. Within that unchanged total, the number of people sleeping unsheltered went from 51 to 85 while the number in shelters fell from 117 to 83, largely because temporary pandemic-era shelters closed.
So visible homelessness on the North Shore rose by two-thirds without the underlying number moving at all. That gap between what people see and what the statistics record explains a lot of the disagreement you will find in local Facebook groups.
Frequently asked questions
Is North Vancouver safe at night?
For most people in most places, yes. The concentration of late-night incidents is in Lower and Central Lonsdale, where the bars and the transit terminal are, and it skews heavily toward mischief and disturbance rather than violence. Residential areas in the District record roughly half the City’s offence rate.
Which is safer, the City or the District of North Vancouver?
The District, on every published measure. Its 2024 rate of 31.9 offences per 1,000 was second lowest among Metro Vancouver’s larger municipalities. Its 2022 Crime Severity Index of 36.29 was well under half the City’s 89.85.
Is North Vancouver safer than Vancouver?
The District clearly is, at 31.9 against Vancouver’s 60.4 in 2024. The City is not, at 66.7. Same name, opposite answers.
Do I need to worry about bears?
You need to manage your garbage, not worry. Follow the District’s 5:30am set-out rule, keep attractants indoors and you will mostly see bears at a distance. Three were killed in North Vancouver in 2025 out of 211 across the whole province.
Where is crime highest in North Vancouver?
Nobody can tell you at neighbourhood level, because the RCMP publishes no neighbourhood data for North Vancouver. Any map or ranking claiming otherwise is a commercial model, not police data. What the municipal figures support is the City-versus-District comparison and nothing finer.
How we put this together
Every figure comes from the Province of British Columbia, the RCMP, Statistics Canada, ICBC, the Conservation Officer Service or the two municipalities, linked where it appears. We have not calculated neighbourhood crime rates, because neither the detachment nor either municipality publishes the data that would make that honest.
Three cautions we would rather print than bury. The offence rates use BC Stats population estimates, which are considerably higher than the 2021 census counts; pairing 2024 offence counts with census populations, as several sites do, inflates both rates by roughly 15 per cent. The 80.6 figure often quoted as “the BC municipal average” is specifically the average for municipalities policed by RCMP municipal units, and municipalities with their own police departments average 55.4. And the violent and property splits stop at 2023, because the 2024 report publishes totals only.
Sources
- BC Ministry of Public Safety and Solicitor General, Police Resources in British Columbia, 2024
- BC Policing Jurisdiction Crime Trends, 2014 to 2023, Appendix D
- Statistics Canada, Crime Severity Index by census metropolitan area, 2024
- City of North Vancouver, Safe Mobility Strategy, July 2020
- North Vancouver RCMP, A Snapshot, presentation to District council, November 2018
- BC Conservation Officer Service, black bear statistics by community, 2025
- North Shore Black Bear Society, year-end report, 2021 to 2022
- District of North Vancouver, Solid Waste Management Bylaw 8436
- 2025 Point-in-Time Homeless Count for Greater Vancouver
- North Vancouver RCMP detachment
Weighing up a specific part of the North Shore? Our area guide covers what each North Vancouver neighbourhood is actually like, and the cost breakdown deals with the other question everyone asks. When you have picked an address, tell us where you are moving from.
