

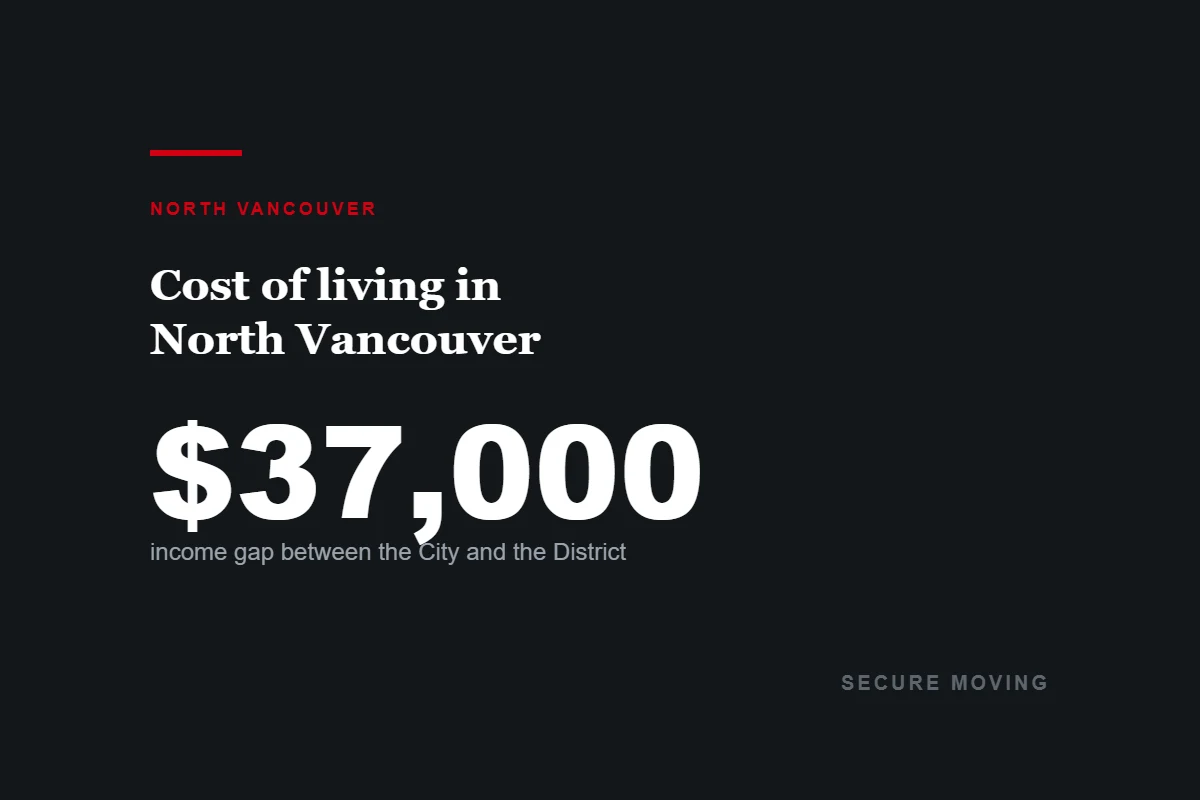
Two municipalities share the name North Vancouver, and the households living in them are separated by $37,000 a year. Median household income in the City is $86,000. In the District it is $123,000. The regional median sits between them at $90,000, which means one North Vancouver is slightly below the regional middle and the other is 37 per cent above it.
Almost every cost-of-living article about this place averages the two together. That produces a number describing nobody. What follows separates them wherever a source allows it, and says so plainly wherever no source does.
The short version
- A one-bedroom in North Vancouver was asking $2,588 a month in July 2026, the highest in Canada, above the City of Vancouver’s $2,377.
- What tenants already here actually pay is lower: CMHC’s October 2025 survey has $2,127 across the City’s purpose-built stock and $2,683 across the District’s.
- The detached benchmark price for North Vancouver was $2,088,400 in August 2026, down 3.6 per cent on the year. Apartments were $770,300.
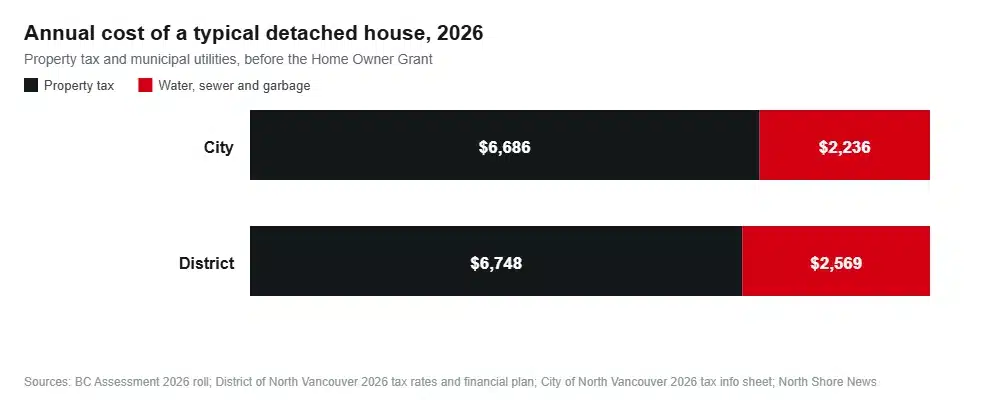
- Tax plus utilities on a typical detached house runs around $8,350 a year in the City and $8,750 in the District, after the Home Owner Grant.
- Across the water in the District, a typical detached home is $19,000 away from losing that grant entirely.
Rent: three numbers, and why they disagree
Rentals.ca put North Vancouver at the top of its national table in July 2026, with a one-bedroom asking $2,588. Headlines ran with that figure, and it measures something specific: what landlords are asking on units that are currently empty.
CMHC measures something else. Its October 2025 survey covers rent actually being paid across purpose-built rental buildings, including tenants who have been in place for years and are protected by BC’s rent increase cap, which is 2.3 per cent for 2026. On that measure the City averages $2,127 and the District $2,683.
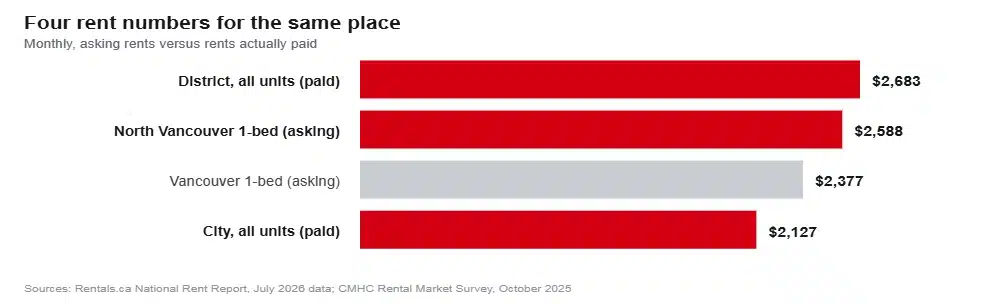
Roughly $460 a month separates what a long-settled City tenant pays from what a newcomer gets quoted. Both numbers are true. Only one of them is available to you if you are moving in this year.
| District of North Vancouver, October 2025 | Average rent | Vacancy |
|---|---|---|
| One bedroom | $2,350 | 2.3% |
| Two bedroom | $2,733 | 4.1% |
| Three bedroom or more | $2,856 | 3.0% |
| All units | $2,683 | 3.3% |
Source: CMHC Rental Market Survey, October 2025, via the District of North Vancouver’s council report of March 2026. City of North Vancouver totals: $2,127 average, 2.9 per cent vacancy.
One thing worth knowing before you quote the District’s headline increase at anyone. Average rent there appears to have jumped 8.4 per cent in a year, but CMHC surveyed 2,049 units in 2025 against 2,549 in 2024. Around 471 of the missing units were moved into a different geography in a CMHC boundary review. Some of that 8.4 per cent is a changed sample rather than rising rent.
Buying
Greater Vancouver Realtors reports North Vancouver as a single area on its home price index. No board-published split exists between the City and the District, so any article showing you separate benchmark prices for each is inventing them.
| August 2026 benchmark | North Vancouver | Year over year | Board-wide |
|---|---|---|---|
| Detached | $2,088,400 | −3.6% | — |
| Townhouse | $1,247,400 | −3.1% | — |
| Apartment | $770,300 | −3.4% | — |
| Composite | $1,305,600 | −2.5% | $1,081,900 |
Source: Greater Vancouver Realtors monthly statistics package, August 2026.
North Vancouver sits about 21 per cent above the regional composite and is falling more slowly than the region, which dropped 5.6 per cent over the same year.
The only official source that does separate the two municipalities is BC Assessment, and it values on a different basis: what a property was worth on 1 July 2025, not what it would sell for today. On the 2026 roll a typical District detached home is $2,056,000 and a typical City one $1,937,000. Both fell three per cent. Typical strata came in at $928,000 and $820,000.
Property tax and utilities, done honestly
Here is where most comparisons of these two municipalities fall apart. Storm drainage and an eco-levy sit on the City’s property tax notice. Its neighbour does not, because District drainage costs sit inside a separately billed sewer utility. Compare tax notices alone and you flatter the District’s rate while hiding its utility bill.
On 2025 rates, the last year both published a full schedule, the City charged 3.21849 per $1,000 of assessed value against the District’s 3.03277. Call it a 6.1 per cent premium per dollar. But District homes are assessed higher, so the actual bills converge.
| Typical detached house, 2026 | City | District |
|---|---|---|
| Assessed value | $1,937,000 | $2,056,000 |
| Property tax | $6,686 | $6,748 |
| Water, sewer, garbage | $2,236 | $2,569 |
| Home Owner Grant | −$570 | −$570 |
| Net annual cost | $8,352 | $8,747 |
No 2026 rate schedule per $1,000 has been published by the City, so its tax figure is derived from the dollar amounts in its own 2026 tax info sheet and carries about one per cent of unexplained slack.
So the tax bills land within $62 of each other, and the $395 gap between the two municipalities is almost entirely the utility bill. District sewer charges alone rose 11.5 per cent this year, to $1,255, because Metro Vancouver’s sewer levy on the District is projected to climb about 22 per cent to $35.2 million in 2026 and possibly $52.8 million by 2030. North Shore Wastewater Treatment Plant cost overruns are arriving on household bills, and it is not finished.
Worth knowing: roughly 57 per cent of a City water and sewer bill is the Metro Vancouver portion rather than the municipal one, so a good deal of what looks like a local charge is regional.
The grant cliff in the District
BC’s basic Home Owner Grant in Metro Vancouver is $570 in 2026, and it starts shrinking once a home is assessed above $2,075,000, at $5 per $1,000, disappearing entirely at $2,189,000.
A typical District detached house is assessed at $2,056,000. That leaves $19,000 of headroom, under one per cent. One assessed at $2,150,000 keeps just $195 of the $570. The typical City detached house has $138,000 of room before the same thing happens.
Assessments move every year. If you are buying a detached home in Lynn Valley or Edgemont, treat the grant as something you may lose rather than something you have.
Utilities and energy
BC Hydro is a single province-wide schedule. Its 2026 fiscal year rates are a 23.30 cent daily basic charge, 11.72 cents per kilowatt hour on the first tier and 14.08 cents above it, with the tier boundary at 22.1918 kilowatt hours a day, roughly 1,376 over a two-month billing period. A further 3.75 per cent increase was approved for 1 April 2026 and the resulting schedule is not published anywhere we could verify, so budget slightly above these.
FortisBC’s residential gas rate on the Mainland from 1 January 2026 is a 40.85 cent daily basic charge plus $11.264 per gigajoule all in. No carbon tax line appears on a BC gas bill any more; the consumer carbon tax was eliminated on 1 April 2025. Any budget you find online still showing one is out of date.
Getting around, and what the inlet costs you
Both North Vancouvers sit entirely in TransLink’s Zone 2, and three rules do most of the work on your transport budget.
Every bus trip is a one-zone fare, all day, everywhere. The SeaBus crosses into Zone 1, so a weekday daytime crossing to Waterfront is a two-zone fare. After 6:30pm on weekdays and all day at weekends, everything drops to one zone.
| TransLink, from 1 July 2026 | Monthly pass | Per year |
|---|---|---|
| One zone, bus only on the North Shore | $117.20 | $1,406 |
| Two zones, daytime SeaBus commute | $156.70 | $1,880 |
| The cost of crossing the inlet at 8am | $39.50 | $474 |
Source: TransLink pricing and fare zones, fares effective 1 July 2026.
Driving carries its own regional surcharge. Metro Vancouver’s fuel tax is 27 cents a litre against 14.5 cents in the rest of the province, of which 18.5 cents funds TransLink. On 1,500 litres a year that is about $188 more than the same driving would cost in Kamloops.
Then there is the part no budget line captures. A District staff report to council in April 2026 found the Ironworkers Memorial carries 130,700 vehicles a day across six lanes, or 21,800 per lane, the heaviest per-lane load of any crossing in the region, and up six per cent on 2019. Lions Gate carries 56,600 across three lanes and is down six per cent. When something goes wrong on either bridge, the report notes, gridlock spreads across the North Shore and can take hours to clear.
What you need to earn
Run the standard test where housing should take no more than 30 per cent of gross income and the two North Vancouvers separate again.
| Scenario | Monthly rent | Household income needed |
|---|---|---|
| CMHC average, City | $2,127 | $85,080 |
| Asking one-bedroom | $2,588 | $103,520 |
| CMHC average, District | $2,683 | $107,320 |
| Two-bedroom, District | $2,733 | $109,320 |
Set those against the medians and the picture is uncomfortable. A City household on the median $86,000 clears the City’s average CMHC rent by $276 a year. That same household needs $103,520 to afford today’s asking one-bedroom without breaking the 30 per cent rule, which it does not have. The median City household cannot afford the median City listing.
Things look easier in the District on its $123,000 median, where average rent takes 26 per cent. But the District’s median renter household earns $80,000, and average rent takes 40 per cent of that. Owning in the District and renting in the District are two different economies.
Living Wage BC put the Metro Vancouver rate at $27.85 an hour per working parent for 2025, built on a three-bedroom rent assumption of $2,107. North Vancouver’s actual three-bedroom average was $2,856, so the real North Shore figure would be meaningfully higher than the published one.
Frequently asked questions
Is North Vancouver more expensive than Vancouver?
On asking rent, yes: $2,588 for a one-bedroom against $2,377 in July 2026. On buying, also yes, with a composite benchmark 21 per cent above the regional figure. On what settled tenants pay, the City of North Vancouver is close to Vancouver and the District is well above it.
Which is cheaper, the City or the District of North Vancouver?
The City, on nearly everything. Lower rents, lower assessed values, a lower utility bill and a household income median $37,000 below the District’s. You are paying for a different housing stock more than a different set of rates.
What is the property tax on a house in North Vancouver?
Roughly $6,700 a year on a typical detached home in either municipality for 2026, plus $2,200 to $2,600 in utilities, less the $570 Home Owner Grant if you qualify. Condos and townhouses pay proportionally less because they are assessed lower.
Is the SeaBus included in a regular fare?
Yes, on the same Compass fare as everything else. It is a two-zone fare on weekdays before 6:30pm and a one-zone fare at all other times, which is about $474 a year for a daily peak commuter.
How much do I need to earn to live in North Vancouver?
Around $85,000 as a household to rent at the City average without exceeding 30 per cent of gross, and closer to $107,000 for the District average. To buy a detached home at the $2,088,400 benchmark you are into territory the District’s own housing report says most households cannot reach.
How we put this together
Figures come from CMHC, Greater Vancouver Realtors, BC Assessment, the Province of British Columbia, Metro Vancouver, TransLink, BC Hydro, FortisBC and the two municipalities’ own financial documents, linked where they appear. Where two credible measures of the same thing disagree, both are shown with an explanation rather than one being picked.
Four gaps we would rather name. The City has not published a 2026 tax rate per $1,000, so its tax figure here is derived from its own published dollar amounts and carries roughly one per cent of unexplained slack. BC Hydro’s April 2026 schedule could not be verified, so the fiscal 2026 rates are used and labelled. No primary source publishes childcare fees for North Vancouver specifically, so we have not quoted any. And the District’s 8.4 per cent average rent rise is partly a changed CMHC sample rather than pure rent growth, which is why the level matters more than the change.
Sources
- District of North Vancouver, CMHC Rental Market Report summary, October 2025 data
- Rentals.ca National Rent Report and methodology
- Greater Vancouver Realtors MLS Home Price Index statistics
- BC Assessment, Lower Mainland 2026 property assessments
- District of North Vancouver 2026 tax rates
- City of North Vancouver 2026 property tax information sheet
- District of North Vancouver 2026 to 2030 approved financial plan
- Province of British Columbia, home owner grant
- FortisBC residential rate schedule 1, effective January 2026
- TransLink pricing and fare zones
- Province of British Columbia, motor fuel and carbon tax rates
- Metro Vancouver Housing Data Book, February 2025
- Living Wage BC, 2025 rates
Pricing a move as well as a month? Our look at what the North Shore crime numbers actually say covers the other question people ask before signing, and the area guide explains which part of North Vancouver suits which budget. When you have an address, tell us where you are moving from.
