

Oak Bay records 25 Criminal Code offences per 1,000 residents a year. Quesnel records 271. On the face of it, that makes Quesnel eleven times more dangerous.
It does not, and understanding why is the single most useful thing in this guide. British Columbia’s crime rate is calculated by dividing offences by the number of people who live in a municipality, while the offences themselves include everything committed by and against people who were only passing through. In a small city that serves as the shopping, hospital and services hub for a much larger rural area, that arithmetic goes badly wrong.
So here are the numbers, and then the explanation of which ones to trust.
The safest communities in British Columbia
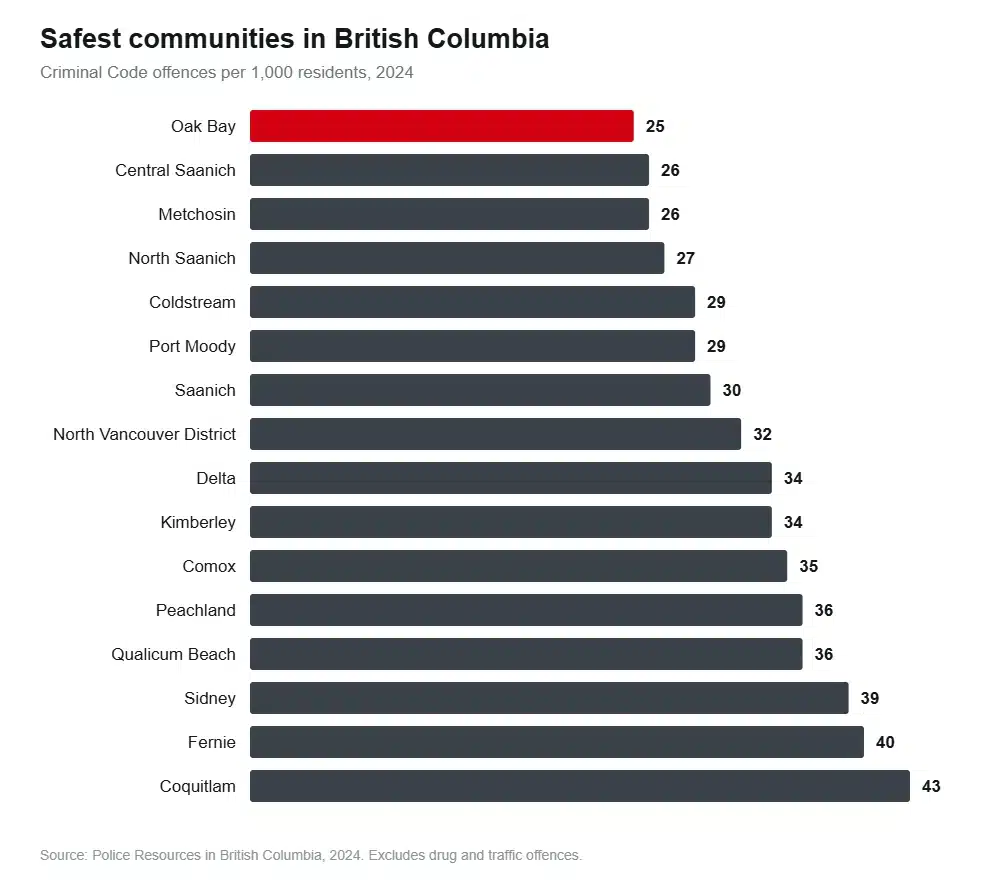
All figures are Criminal Code offences per 1,000 residents in 2024, excluding drug and traffic offences, from the province’s annual policing report.
| Community | Offences per 1,000 | Population | Where |
|---|---|---|---|
| Oak Bay | 25 | 18,803 | Greater Victoria |
| Central Saanich | 26 | 18,135 | Greater Victoria |
| Metchosin | 26 | 5,332 | Greater Victoria |
| North Saanich | 27 | 13,349 | Greater Victoria |
| Coldstream | 29 | 11,548 | North Okanagan |
| Port Moody | 29 | 38,943 | Metro Vancouver |
| Saanich | 30 | 125,444 | Greater Victoria |
| North Vancouver District | 32 | 102,285 | Metro Vancouver |
| Delta | 34 | 127,830 | Metro Vancouver |
| Kimberley | 34 | 9,011 | East Kootenay |
| Comox | 35 | 15,969 | Vancouver Island |
| Spallumcheen | 35 | 5,786 | North Okanagan |
| Peachland | 36 | 6,197 | Central Okanagan |
| Qualicum Beach | 36 | 9,360 | Vancouver Island |
| Sidney | 39 | 13,289 | Greater Victoria |
| Fernie | 40 | 7,009 | East Kootenay |
| Coquitlam | 43 | 174,307 | Metro Vancouver |
| Lake Country | 43 | 17,499 | Central Okanagan |
| Port Coquitlam | 44 | 69,305 | Metro Vancouver |
| Armstrong | 46 | 5,778 | North Okanagan |
| Pitt Meadows | 46 | 21,699 | Metro Vancouver |
| West Vancouver | 47 | 52,280 | Metro Vancouver |
| View Royal | 50 | 12,616 | Greater Victoria |
| Kent | 50 | 8,100 | Fraser Valley |
| Langley Township | 51 | 162,928 | Metro Vancouver |
| Summerland | 51 | 12,492 | South Okanagan |
| Langford | 52 | 58,309 | Greater Victoria |
| Surrey | 52 | 700,541 | Metro Vancouver |
| Ladysmith | 53 | 9,895 | Vancouver Island |
| West Kelowna | 54 | 40,094 | Central Okanagan |
Source: Police Resources in British Columbia, 2024, BC Ministry of Public Safety and Solicitor General, published December 2025. The report itself cautions against reading too much into cross-jurisdiction comparisons.
What the pattern shows
Greater Victoria dominates the top of this list, taking five of the six safest spots. Oak Bay, Central Saanich, Metchosin, North Saanich and Saanich are all residential municipalities inside a larger urban area, with the region’s commercial districts, entertainment and transit hubs sitting next door in the City of Victoria, which records 87.
That is the pattern in miniature. Quiet residential suburbs next to a busy centre look extraordinarily safe, because the crime attached to the shops, bars and services is recorded in the neighbouring municipality.
Metro Vancouver’s safest are Port Moody at 29, North Vancouver District at 32, Delta at 34 and Coquitlam at 43, all comfortably below the provincial municipal averages.
The denominator problem
Now the part that most rankings skip entirely.
Consider Duncan. It records 268 offences per 1,000, second-highest in the province, which sounds alarming until you notice its population: 5,669. Duncan is a 2.1 square kilometre city surrounded by the District of North Cowichan, which has 34,503 residents. The hospital, the shopping, the courthouse and the services are in Duncan. So is the crime attached to them, divided by a resident population one-sixth the size of the area it actually serves.
The same distortion inflates several of BC’s apparently worst places:
| Community | Rate per 1,000 | Population | What it serves |
|---|---|---|---|
| Quesnel | 271 | 10,238 | Regional hub for the north Cariboo |
| Duncan | 268 | 5,669 | Commercial centre of the Cowichan Valley |
| Merritt | 226 | 7,285 | Highway junction and Nicola Valley hub |
| Hope | 217 | 6,832 | Junction of three highways |
| Prince George | 180 | 84,907 | Service centre for northern BC |
| Smithers | 177 | 5,653 | Bulkley Valley hub |
| Williams Lake | 171 | 11,382 | Central Cariboo hub |
| Port Alberni | 169 | 19,685 | Central Island hub |
| Terrace | 166 | 13,251 | Northwest BC hub |
| Penticton | 165 | 38,767 | South Okanagan hub and tourist town |
None of this means those places are gentle. Regional hubs concentrate real problems: addiction services, shelters, courts and the transient populations that come with all three. It means the ratio overstates what a resident experiences, and it overstates it most where the town is smallest relative to the area it serves.
Whistler is the cleanest illustration of the visitor version. The resort records 65 offences per 1,000 against 15,620 residents, in a resort that hosts several million visitor-nights a year. A crime committed by a visitor against a visitor lands entirely on the residents’ side of the ratio.
How to read the table properly
Three rules make these numbers useful rather than misleading.
Compare like with like. A suburb against a suburb, a regional hub against a regional hub. Comparing Oak Bay with Quesnel tells you about municipal boundaries, not about danger.
Watch the population column. Any community under about 15,000 with a high rate is probably a service centre for a much larger area. Metchosin at 5,332 people and 26 offences per 1,000 is a genuinely quiet place; Duncan at 5,669 and 268 is a busy town centre with a small tax base.
Remember what is counted. The rate covers Criminal Code offences excluding drugs and traffic, and it is dominated by property crime. A high rate usually means a lot of theft from vehicles and shoplifting, not a lot of violence.
The provincial benchmarks
The report groups jurisdictions by policing model, and the averages differ:
- Municipal police departments (Vancouver, Victoria, Saanich, Delta, Abbotsford, New Westminster, Oak Bay, Port Moody, Central Saanich, West Vancouver, Nelson): average 55 per 1,000
- RCMP municipal units, 15,000 and over: average 79
- RCMP municipal units, 5,000 to 14,999: average 91
- Provincial policing areas: average 66
Smaller communities average higher, which is the denominator problem showing up in the aggregate rather than an argument that towns are more dangerous than cities.
A different measure worth knowing
The crime rate counts every offence equally, so a stolen bicycle and an assault carry the same weight. The Crime Severity Index does not: it weights each offence by how seriously the courts treat it, which is a better guide to whether serious crime is happening.
On that measure, Statistics Canada put the Vancouver census metropolitan area at 83.5 in 2025 against a national figure of 75.0 and a British Columbia figure of 92.4. Among BC metro areas, Victoria was lowest at 74.6, then Vancouver, with Abbotsford-Mission at 95.5, Kelowna 103.7, Nanaimo 106.0, Kamloops 126.2 and Chilliwack 134.3.
Notice that this reorders things. Kelowna looks middling on offence counts and worse on severity; Victoria looks poor on the municipal crime rate at 87 and best in BC on severity.
So where is actually safest?
If you want the short answer for a family choosing a place to live in British Columbia, and you weight it for size and services rather than pure ratio:
Greater Victoria’s residential municipalities are the genuine standouts. All of Oak Bay, Saanich, Central Saanich, North Saanich and Sidney sit under 40, and Saanich manages 30 with 125,444 residents, which is a large population to keep that low.
In Metro Vancouver, Port Moody at 29, North Vancouver District at 32, Delta at 34 and Coquitlam at 43. All four are substantial communities rather than small enclaves.
In the Interior, Kimberley at 34, Coldstream at 29, Peachland at 36 and Summerland at 51. Fernie at 40 is notable for a resort town.
On Vancouver Island outside Victoria, Comox at 35, Qualicum Beach at 36 and Ladysmith at 53.
Frequently asked questions
What is the safest city in BC?
By reported Criminal Code offences per resident in 2024, Oak Bay at 25 per 1,000. Among larger municipalities, Saanich at 30 with over 125,000 residents is the more meaningful answer, since very small communities can post low rates simply by having no commercial district.
What is the safest city in Metro Vancouver?
Port Moody at 29 offences per 1,000, followed by the District of North Vancouver at 32 and Delta at 34. Vancouver itself records 60 and New Westminster 61.
Which BC city has the highest crime rate?
Quesnel at 271 per 1,000, then Duncan at 268 and Merritt at 226. All three are small municipalities acting as service centres for much larger surrounding populations, which inflates the ratio substantially.
Are small towns in BC safer than cities?
On these figures, no. RCMP-policed municipalities of 5,000 to 14,999 averaged 91 offences per 1,000, against 55 for the municipal police departments, which cover most of the province’s larger cities. That gap is mostly the denominator problem rather than a real safety difference.
Is Victoria safe?
The City of Victoria records 87 offences per 1,000, above the provincial department average, because it holds Greater Victoria’s downtown, entertainment district and services. The residential municipalities around it, Oak Bay, Saanich and the Saanich Peninsula, are among the safest in the province. Victoria also has the lowest Crime Severity Index of any BC metro area at 74.6, meaning the crime it does record is less serious on average. If those suburbs are on your list, we also handle moves from Vancouver to Victoria, ferry included. The two forces with the largest caseloads get their own breakdowns: Vancouver and Surrey.
How we put this together
Every rate comes from Police Resources in British Columbia, 2024, the province’s annual report, published in December 2025. It defines the crime rate as Criminal Code offences excluding drugs and traffic per 1,000 residents, using BC Stats population estimates matched to police jurisdiction boundaries. Crime Severity Index figures are from Statistics Canada’s 2025 release.
Two limits worth naming. The 2025 edition of the provincial report is not yet published, so 2024 is the most current municipal data available. And police-reported crime measures what gets reported: car break-ins are usually reported for insurance while minor assaults frequently are not, so the mix varies by offence type as well as by place.
Sources
- Police Resources in British Columbia, 2024
- Province of BC, crime and police resource statistics
- Statistics Canada, Crime Severity Index by census metropolitan area, 2025
- Statistics Canada, Police-reported crime statistics in Canada, 2025
The North Shore is a good example of why the municipality matters more than the region: North Vancouver’s two halves sit at opposite ends of this table.
For a closer look at one pair, Maple Ridge and Pitt Meadows split their shared detachment in two in April 2026, which changes how their numbers will be reported from here.
Port Moody is the quietest municipality of any real size in Metro Vancouver, and its two neighbours are not: Coquitlam and Port Coquitlam sit around fifteen points higher on the same measure. We have gone through the Tri-Cities numbers in full, including the 2019 counting change that shows up in all three at once.
New Westminster is the odd one out on this list, because it runs its own police force and pays near the top of the region for it. We have gone through its numbers separately, including the population estimate that trips up most of the figures in circulation.
Richmond sits mid-pack among Metro Vancouver municipalities at 56.8 offences per 1,000, and it is the one place in the region where a peer-reviewed study tested whether rapid transit brought crime with it. We have set out what that study found.
Safety is one column of a much wider table. Our comparison of BC communities adds jobs, weather and access to a family doctor, and the affordability side is where most shortlists actually get decided. We move households all over British Columbia. Ask us for a quote.
