

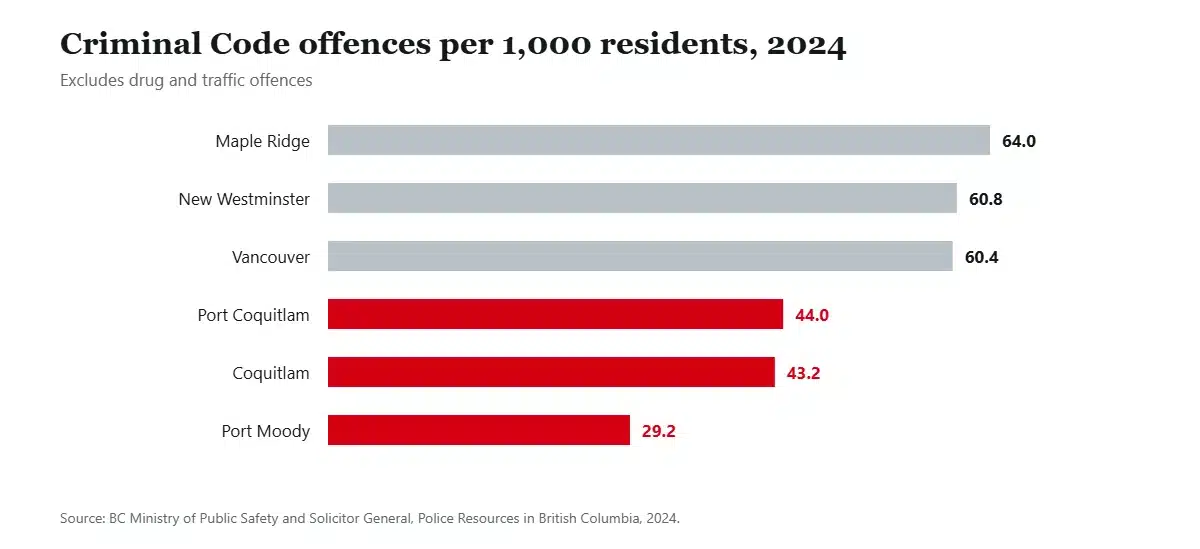
Ask about safety in the Tri-Cities and you get three answers, because these are three separate municipalities with three separate police services. In 2024 Coquitlam recorded 43.2 Criminal Code offences per 1,000 residents, Port Coquitlam 44.0 and Port Moody 29.2.
All three sit below every larger municipality in Metro Vancouver. Port Moody sits below them by a distance, and there is a reason nobody writes down: it spends 62 per cent more per resident on policing than Coquitlam does.
The short version
- Port Moody has the lowest crime rate of any Metro Vancouver municipality of real size, at 29.2 per 1,000. That city also runs its own police department rather than an RCMP detachment.
- Coquitlam and Port Coquitlam are within two per cent of each other and effectively identical on this measure.
- They all sit well under Vancouver at 60.4, New Westminster at 60.8 and Maple Ridge at 64.0.
- Rates have fallen over the decade, but violent offence counts rose in all three, and a large part of that rise lands exactly on a 2019 change in counting rules.
- No study of crime around the Evergreen Extension exists. The closest analogue, on the Canada Line, found reported crime fell after the line opened.
Three cities, three police services
| 2024 | Coquitlam | Port Coquitlam | Port Moody |
|---|---|---|---|
| Police service | RCMP | RCMP | Own department |
| Population | 174,307 | 69,305 | 38,943 |
| Criminal Code offences | 7,524 | 3,052 | 1,139 |
| Rate per 1,000 | 43.2 | 44.0 | 29.2 |
| Authorized officers | 179 | 76 | 53 |
| Residents per officer | 930 | 868 | 714 |
| Policing cost per resident | $246 | $263 | $398 |
Source: Police Resources in British Columbia, 2024, published December 2025.
That last row is the one worth sitting with. The Port Moody force runs 714 residents per officer against Coquitlam’s 930, and the bill lands on the tax notice. Low crime in a small municipality is partly geography, partly demographics and partly a spending decision made at council.
The other structural difference: Coquitlam has a regional shopping centre and the Lougheed and United Boulevard commercial corridor. Its neighbour has neither. Retail and commercial districts generate reported offences regardless of how quiet the residential streets are, which is most of why the two RCMP cities sit fifteen points higher.
A decade of numbers, and the trap in them
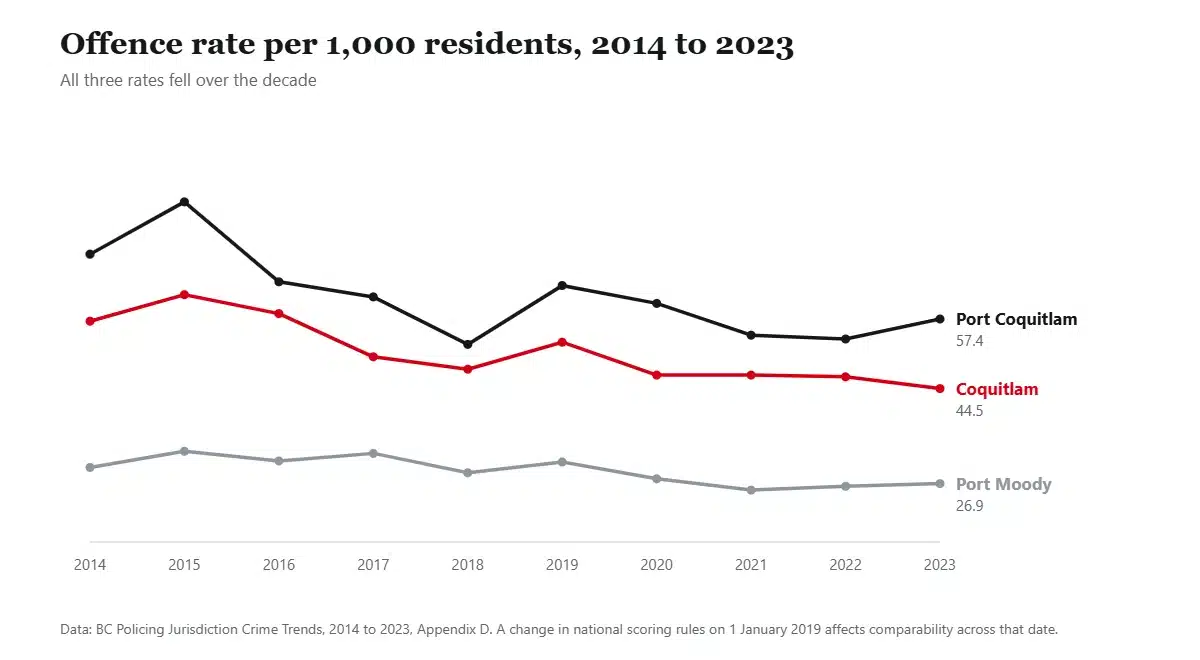
Rates fell in all three over the decade: Coquitlam from 57.0 to 44.5, Port Coquitlam from 69.4 to 57.4, Port Moody from 29.9 to 26.9. Offence counts barely moved, so most of that improvement is the population growing faster than the crime.
Now the part almost every safest-cities article skips. Violent offence counts rose over the same decade in all three: Coquitlam from 934 to 1,512, Port Coquitlam from 513 to 756, Port Moody from 119 to 235.
Before anyone panics, look at where the step happens. Between 2018 and 2019 the violent count jumped in Coquitlam from 1,028 to 1,207, in Port Coquitlam from 599 to 729 and in Port Moody from 168 to 227. Three independent jurisdictions moving together in one year is the fingerprint of a counting-rule change, not a regional crime wave, and 1 January 2019 is exactly when Canadian police forces adopted revised scoring rules and BC changed its own recording policy. Some of the rise is real. A meaningful share of it is definitional, and the province prints its own warning about comparing across that date.
How the Tri-Cities compare on severity
Crime rate counts every offence equally. The Crime Severity Index weights them, so a homicide moves it far more than a bike theft.
For 2024 the reported municipal figures were Coquitlam 55.2, Port Coquitlam 57.4 and Port Moody 45.3, against 81.2 for the Vancouver census metropolitan area as a whole. Coquitlam’s non-violent index was its lowest since the series began in 1998, and Port Coquitlam’s combined index likewise.
One honest wrinkle. The lowest combined index of the three belongs to Port Moody, which also has the highest violent index, at 51.3. That sounds alarming until you see the base: 235 violent Criminal Code offences in a year across a city of 39,000. In a place that small, a handful of serious files moves the index hard. It is worth knowing and it is not a trend.
The SkyTrain question
The Evergreen Extension opened in December 2016 and it is the thing people ask about most. Here is everything that is actually known.
Transit Police do not publish station-level statistics. The only Tri-Cities figures that exist came out through a freedom of information request: 43 crimes against persons across all Tri-Cities SkyTrain stations over two full years, 2019 and 2020 combined. More than half were at Coquitlam Central. Most were common assaults, and charges were laid in about 30 per cent of cases.
For scale, Coquitlam alone recorded 1,207 violent Criminal Code offences in 2019 and 1,276 in 2020.
Nobody has studied crime around the Evergreen Extension. The nearest thing is peer-reviewed research on the Canada Line in Richmond, which ran a time-series analysis on RCMP data within 250 metres of seven stations and found reported crime decreased after the line opened. Coquitlam’s own rate went from 58.4 in the opening year to 50.4 and then 48.1 in the two years after, though crime was falling across the region at the same time, so that is correlation and nothing more.
System-wide, Transit Police recorded 1,552 crimes against persons in 2024, up seven per cent in count, but the rate per 100,000 passengers fell ten per cent because boardings changed. If you see the count quoted without the rate, someone is picking the scarier of two true numbers.
What you will actually deal with
Retail theft, rather than burglary. Coquitlam’s property crime rose 9.5 per cent in 2024 and 19 per cent in 2025, to 5,091 files, and the driver was shoplifting, which is now the most frequent property crime type in the city and up 65 per cent on its three-year average. Which is a commercial-district story, not a story about houses.
Residential break-ins run at roughly 45 a year in Port Coquitlam and 31 in Port Moody. Those are real numbers across whole cities.
Theft from vehicles is the property crime you are most likely to meet, and it is falling. Vehicle break-ins across BC are down 60 per cent since 2016, and Port Coquitlam’s own quarterly numbers had theft from vehicles at 65 in a quarter against a three-year average of 104. Theft of vehicles moved the other way there, 39 against an average of 27, which is a useful reminder that the two are different crimes with different fixes.
The risk that really is higher here
The interchange at Brunette Avenue and Highway 1 in Coquitlam recorded 331 crashes in 2024, fourth worst in the Lower Mainland. The Mary Hill Bypass area around United Boulevard recorded 245, seventh worst. Barnet and Lougheed at Pinetree Way logged 109. Across the three municipalities there were 13,349 crashes in 2024, up 41 per cent on 2020.
Every one of those hotspots is a highway ramp or a bypass junction rather than a residential street, and Coquitlam has adopted Vision Zero and is building a road safety strategy around ICBC and police crash data.
Bears, and the rule with a $1,000 fine attached
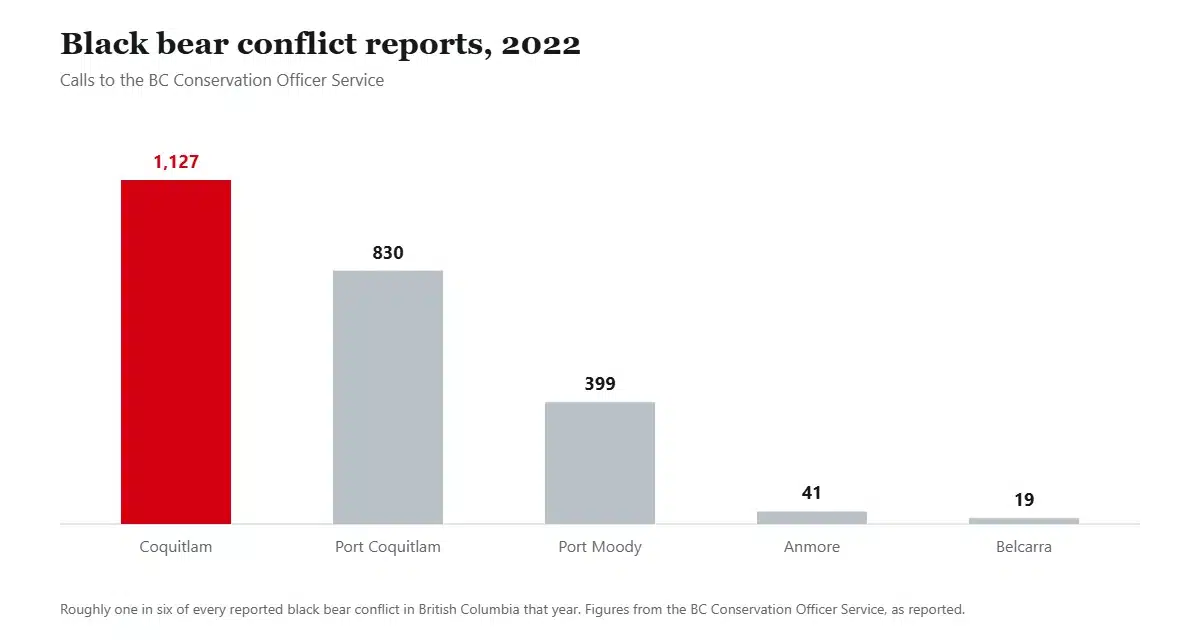
The Tri-Cities logged 2,416 bear conflict reports in 2022: 1,127 in Coquitlam, 830 in Port Coquitlam, 399 in Port Moody, 41 in Anmore and 19 in Belcarra. That is a genuinely high number and it comes with the territory of building suburbs against a mountain.
The good news is that it is a managed problem. Coquitlam issued 843 warnings and 123 tickets in 2022, down from 4,914 warnings and 450 tickets in 2017.
The rule to put in your calendar: in Port Coquitlam carts go out between 5:30 and 7:30am on collection day and come back in by 7pm, with $500 fines under the solid waste bylaw. Coquitlam’s fines run up to $500 under its own bylaws. Strictest of the three is Port Moody, at $500 for a first offence, $750 for a first repeat and $1,000 after that, having raised those fines tenfold.
Frequently asked questions
Is Coquitlam a safe place to live?
By Metro Vancouver standards, yes. Its 2024 rate of 43.2 offences per 1,000 sits below Vancouver, Burnaby, Richmond, Surrey, New Westminster and Maple Ridge, and its Crime Severity Index of 55.2 is well under the regional figure of 81.2.
Which Tri-City is safest?
Port Moody, at 29.2 offences per 1,000 in 2024, the lowest of any Metro Vancouver municipality of meaningful size. It also spends $398 per resident on policing against Coquitlam’s $246, which is part of the explanation.
Did the SkyTrain make Coquitlam less safe?
No published evidence says so, and there is no study of the Evergreen Extension either way. Coquitlam’s crime rate fell in the two years after the line opened, research on the Canada Line found the same pattern there, and the only station-level figures for the Tri-Cities are 43 crimes against persons across two full years.
Is crime going up in the Tri-Cities?
Property crime in Coquitlam rose 19 per cent in 2025, driven by shoplifting rather than residential break-ins. Rates across all three cities have fallen over the decade. Violent counts rose, though the 2019 counting-rule change accounts for part of that.
Do I need to worry about bears in Coquitlam?
You need to manage your garbage. Coquitlam alone logged 1,127 bear conflict reports in 2022, and all three cities carry $500 attractant fines, rising to $1,000 in Port Moody for repeat offences. Follow the collection-day set-out window and you will mostly see bears from a distance.
How we put this together
Figures come from the Province of British Columbia, Statistics Canada, the Port Moody Police Department, the RCMP, Metro Vancouver Transit Police, ICBC and the Conservation Officer Service, linked where they appear. We have not calculated neighbourhood crime rates, because none of the three services publishes the data that would make that honest.
Four cautions we would rather print than bury. The 2019 scoring change means figures either side of that date are not cleanly comparable, and we have said so wherever it matters. Municipal Crime Severity Index values could not be extracted from Statistics Canada’s own table, which renders dynamically, so they come from reporting that cites the release. Coquitlam RCMP publish no line-item annual crime statistics, so the offence-level detail here is fuller for Port Moody and Port Coquitlam than for Coquitlam. And a couple of Mary Hill Bypass intersections are attributed differently by different ICBC compilations, because the corridor runs along a municipal boundary.
Sources
- BC Ministry of Public Safety and Solicitor General, Police Resources in British Columbia, 2024
- BC Policing Jurisdiction Crime Trends, 2014 to 2023, Appendix D
- Statistics Canada, Crime Severity Index by census metropolitan area, 2024
- Statistics Canada table 35-10-0063, Crime Severity Index by police service in British Columbia
- Metro Vancouver Transit Police, report to the community, 2024
- Gallison, crime along the Canada Line, Security Journal, 2016
- ICBC, ten-year auto crime data, May 2026
- City of Coquitlam, wildlife management
- City of Port Coquitlam, bears and solid waste bylaw
- City of Port Moody, solid waste bylaw fines
- City of Coquitlam, road safety strategy
Braid Station anchors one of Coquitlam’s transit-oriented areas but sits in New Westminster, a city that keeps its own police force and its own statistics. We have worked through those numbers too.
Weighing up a particular part of the Tri-Cities? Our area guide covers what each neighbourhood is actually like, and the cost breakdown deals with the question most people ask next. When you have settled on an address, tell us where you are moving from.
