

Chilliwack has the highest police-reported crime rate and the highest Crime Severity Index of any census metropolitan area in Canada. That was true in the 2024 figures, and Statistics Canada’s 2025 release on 22 July 2026 confirmed it again. Anyone telling you the reputation is unfounded has not read the tables.
What that ranking does not tell you is how a Tuesday evening in Promontory compares with one near Five Corners, or whether your car is likely to be broken into. Those are different questions, and the national headline answers none of them. This page separates the three.
The 2025 numbers, exactly as published
| Measure | Chilliwack CMA | British Columbia | Canada |
|---|---|---|---|
| Crime Severity Index | 134.3 | 92.4 | 75.0 |
| Crime rate per 100,000 | 11,455 | 6,943 | 5,585 |
Reference year 2025. Source: Statistics Canada, police-reported crime statistics, released 22 July 2026.
Chilliwack’s severity index runs about 1.45 times the provincial figure and 1.8 times the national one. On crime rate the gap is wider: roughly 1.65 times BC and just over twice the Canadian rate.
Against 2024, Statistics Canada reported the severity index down 4% and the crime rate up 3%. Both are the agency’s own published changes, and they are worth quoting rather than calculating, because Statistics Canada revises the prior year when it publishes a new one. Subtracting last year’s press release from this year’s produces a different and wrong answer.
So the direction is mixed. Severity eased slightly. Volume did not.
Two numbers, two different things
Coverage routinely calls both of these “the crime rate”, which muddles the picture.
Crime rate counts incidents per 100,000 people. Every offence weighs the same, so a thousand bike thefts move it much more than one assault.
Crime Severity Index weights each offence by the average sentence handed down for it, then indexes the result against 2006 equalling 100. Serious crime pushes it up hard; volume crime barely nudges it.
Chilliwack ranking first on both is unusual and it means something specific. A place can top the rate table on sheer volume of minor property crime while sitting mid-table on severity. Chilliwack does not.
Which Chilliwack the numbers describe
These figures cover the Chilliwack census metropolitan area, a region wider than the city. The BC Ministry of Public Safety reports separately on the Chilliwack RCMP’s own jurisdiction, and for 2024 recorded 12,468 Criminal Code offences across a population of 107,769, which the ministry expresses as a rate of 116 per 1,000.
Do not line that 116 up against the 11,455 above. One is per thousand and one is per hundred thousand, across two different boundaries. Converted onto the same basis they land close together, but they are not the same measurement, and seeing them side by side in an article is a reliable sign the writer did not check.
The same ministry report puts Chilliwack RCMP’s authorized strength at 152 officers, a caseload of 75 files per officer, and policing costs of $43.9 million, or $407 per resident.
Mostly property crime, and nobody publishes the split
Violent and non-violent severity are broken apart at the provincial and national level only, never by metropolitan area. So a specific “X% of Chilliwack’s crime is property crime” figure does not exist, and any page giving you one made it up.
What the local evidence shows is heavy weighting toward property offences. Chilliwack RCMP runs a dedicated Property Crimes Section with six plainclothes investigators, deploys a BAIT car decoy programme close to weekly, and has found that roughly 30% of auto-theft reports it investigated turned out to be fraudulent, work that has saved more than $500,000 alongside ICBC.
One published week gives a sense of proportion. In the detachment’s snapshot for 4 to 10 May 2026, of 847 calls for service, 146 were coded property crime and 61 crimes against persons. Treat that as one week of calls, not a year of Criminal Code incidents, and do not line it up against the tables above. As a rough indication of what officers spend their days on, it holds.
Worth noting against the “just property crime” reading: BC’s violent severity index actually rose 2.2% in 2025 while non-violent fell 3.2%. No Chilliwack-specific violent trend is published to check that against.
Neighbourhood by neighbourhood, and why nobody can tell you
No official source publishes crime statistics for Sardis, Promontory, Garrison Crossing, Fairfield Island, Vedder or downtown Chilliwack. Not Statistics Canada, which stops at the metropolitan area. The City of Chilliwack’s neighbourhood profiles carry demographics and housing data and no crime data at all. Nor does the RCMP.
Sites that rank Chilliwack neighbourhoods by a “crime score” are generating those from models, not from police data. They read as authoritative and they are not.
Two things you can actually do:
Use the city’s own incident map. Chilliwack publishes an interactive map of reported incidents by category, including auto theft and break-and-enter. It shows individual incidents rather than rates, so you cannot rank areas from it, but you can look at the blocks you are considering and see what has been reported there. It is at chilliwack.com under the Crime Prevention Toolkit.
Read the housing mix instead. The city’s neighbourhood profiles show tenure, dwelling type and median age per area. Owner-occupied, family-heavy, newer-build neighbourhoods tend to feel different from dense rental areas, and that is most of what people are really asking about when they ask which parts are safe. Promontory has the youngest median age in the city at 36.0 and 84% owner-occupied households; Chilliwack Proper is 58% owner-occupied with a median household income of $55,600. Our guide to the city’s neighbourhoods sets out all twelve.
RCMP costs are 2.95 points of a 4.9% tax rise
Chilliwack council raised property tax 4.9% for 2026, and 2.95 percentage points of that increase is RCMP contract costs alone. The 2026 financial plan funds two more RCMP positions plus three firefighters and a fire chief, explicitly to bring down per-officer caseloads.
At an August 2025 council briefing the detachment’s officer in charge, Supt. Darren Pankratz, acknowledged the national ranking directly, pointed to proactive patrols and Project SAFE, and reported that the highest-urgency Priority 1 calls had risen from 750 to 897.
On the prevention side the city runs Block Watch, Business Watch, Speed Watch, Crime Free Multi-Housing and environmental design consultations through Chilliwack Crime Prevention Services.
What it means day to day: lock things up
The practical shape of Chilliwack’s crime problem is that things left outside tend to go missing, and vehicles are a target. That is an inconvenience-and-insurance problem rather than a personal-safety one for most residents, which is why the lived experience and the national ranking sit so far apart.
Reasonable precautions here are the ordinary ones, applied consistently: nothing visible in the car, nothing valuable in an unlocked shed, a camera at the door, and joining the Block Watch if your street has one. If you are comparing the valley city by city, our read on Abbotsford’s numbers covers the next city west, Maple Ridge sits considerably lower on the same measures, and we ranked the province’s safest cities on the same Statistics Canada basis.
Crime is one input. The cost of living here and the question of whether the city suits you at all are the other two.
Moving to Chilliwack
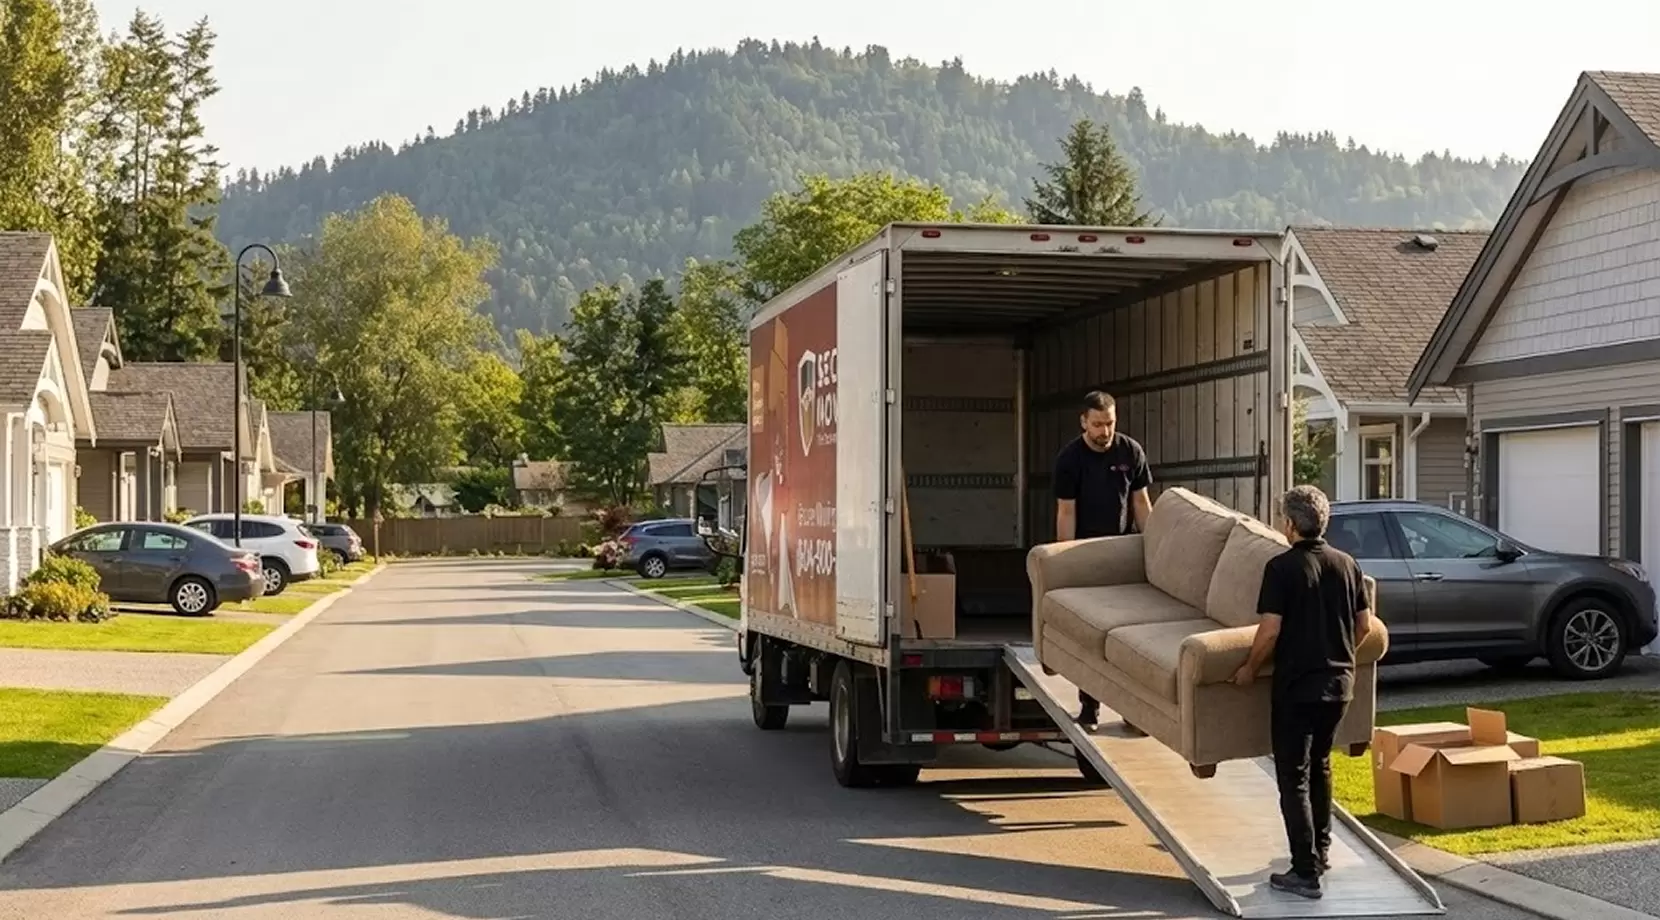
Moving day has its own small security problem: a truck open at the curb, boxes on a driveway, doors propped. A crew that works the area knows to stage loads rather than leave them sitting. Our Chilliwack movers run this valley weekly, and as a Vancouver moving company we handle the trip in both directions.
Frequently asked questions
Is Chilliwack a safe place to live overall?
Statistically it has the highest crime rate and highest Crime Severity Index of any Canadian census metropolitan area, confirmed again in the 2025 Statistics Canada data. The weighting is heavily toward property crime, so the everyday risk most residents face is theft rather than violence. Experience varies by street, and no official neighbourhood-level data exists to map that.
What is Chilliwack’s crime rate in 2026?
The most recent figures are for reference year 2025, published 22 July 2026: a crime rate of 11,455 per 100,000 and a Crime Severity Index of 134.3 for the Chilliwack census metropolitan area. The rate was up 3% and the severity index down 4% against 2024, on the agency’s own published figures.
Why is Chilliwack’s crime rate so high?
Volume of property crime is the main driver, and the city’s own policing effort reflects that, with a six-investigator Property Crimes Section and a near-weekly BAIT car programme. Statistics Canada does not publish a violent-versus-property split by metropolitan area, so no precise percentage exists. Caseload pressure is also real: 75 files per officer in the 2024 provincial policing report.
What are the safest neighbourhoods in Chilliwack?
Nobody publishes crime data by Chilliwack neighbourhood, so this cannot be answered with police figures, and sites that rank neighbourhoods by crime score are modelling rather than measuring. The city’s interactive incident map lets you check specific blocks yourself, and its neighbourhood profiles show tenure and dwelling mix, which is closer to what most people are actually asking.
Is Chilliwack getting safer?
Partly. The Crime Severity Index fell 4% in 2025 while the crime rate rose 3%. Chilliwack still ranks first in Canada on both measures. Council added police and fire positions in its 2026 budget, funded by a tax increase of which nearly three points went to RCMP costs.
