

Almost every article you will find about crime in Maple Ridge describes a police detachment that no longer exists. On 1 April 2026 the integrated Ridge Meadows RCMP split into two autonomous detachments, one for Maple Ridge and one for Pitt Meadows, after a process the Province approved back in 2021. The Pitt Meadows side went from two dedicated officers per shift to five.
That matters for a practical reason. Every crime figure published for this area, including the ones below, comes from the years when both cities were policed as one unit. The first provincial numbers reported separately will not land until December 2027.
The short version
- Maple Ridge recorded 64.0 Criminal Code offences per 1,000 residents in 2024, against 46.3 next door in Pitt Meadows.
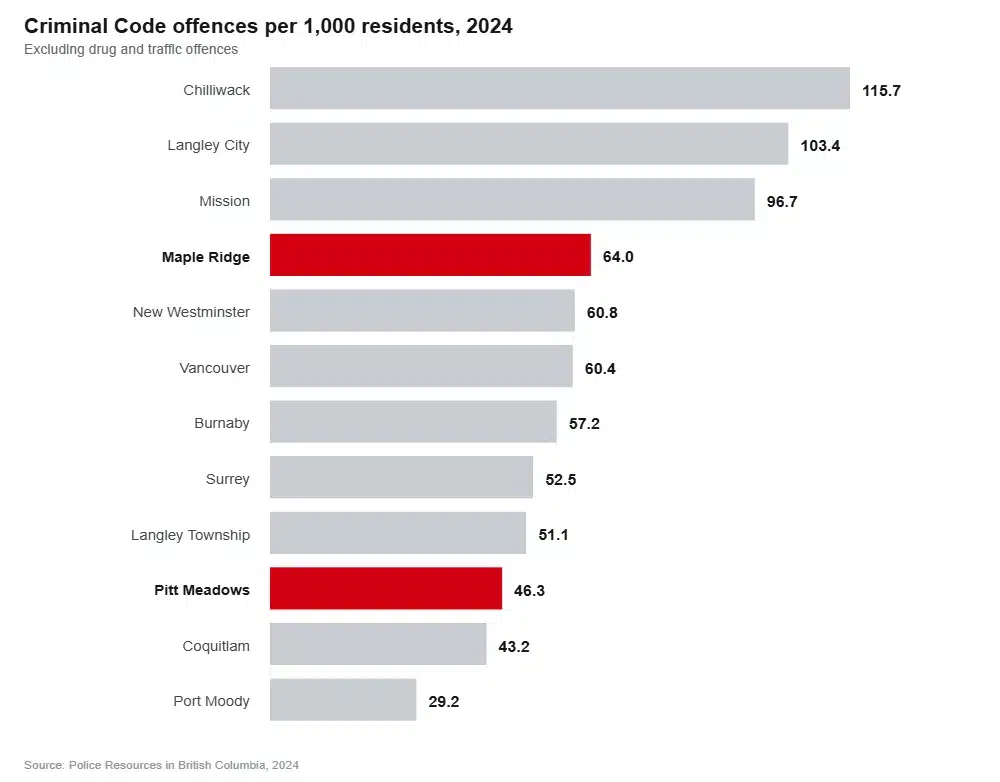
- That sits about a fifth below the average for BC cities policed by RCMP municipal detachments, and well below Chilliwack, Langley City and Mission.
- Rates have fallen 38.6 per cent since the 2019 peak, though part of that peak was a change in how offences get counted.
- Offence counts have been flat for three years, so the rate falls mainly because the city keeps growing.
- Homelessness moved the other way: the Ridge Meadows count rose 35.6 per cent between 2023 and 2025, against 8.5 per cent regionally.
The numbers, and how the two cities differ
| 2024 | Maple Ridge | Pitt Meadows |
|---|---|---|
| Population | 106,493 | 21,699 |
| Criminal Code offences | 6,819 | 1,005 |
| Rate per 1,000 | 64.0 | 46.3 |
| Authorized officers | 120 | 24 |
| Residents per officer | 821 | 850 |
| Policing cost per resident | $294 | $280 |
Source: Police Resources in British Columbia, 2024, published December 2025. Officer numbers reflect the integrated detachment as it stood before the April 2026 split.
Pitt Meadows runs 27.7 per cent below its neighbour. Neither is policed intensively by provincial standards for RCMP-served municipalities, carrying more residents per officer and spending less per head.
The comparison everybody gets wrong
You will read that the BC average is 80.6 offences per 1,000 and that Maple Ridge is comfortably under it. Half of that is right.
That 80.6 figure is the average for municipalities policed by RCMP municipal units, not a provincial average and not a general municipal average. Cities that run their own police departments average 55.4, and that group is mostly dense older cities policed far more intensively, at 585 residents per officer against 799.
So the city is roughly a fifth below one benchmark and somewhat above the other, and neither group is a clean comparison. The useful comparison is with the neighbours: Maple Ridge sits above Coquitlam, Port Coquitlam, Langley Township and Surrey, below Chilliwack, Langley City and Mission, and just above Vancouver and New Westminster.
A decade of numbers
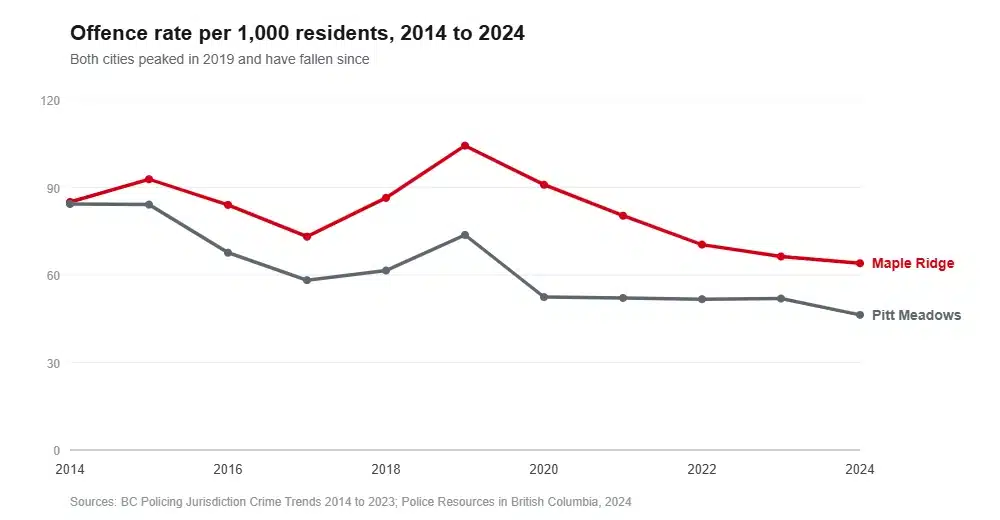
Both cities peaked in 2019, at 104.3 in Maple Ridge and 73.7 in Pitt Meadows, then fell hard, by 38.6 and 37.2 per cent respectively.
Two honest qualifications. Part of the 2019 spike was definitional rather than real. Police forces across Canada changed how offences are scored on 1 January 2019, following a Statistics Canada revision to what counts as a founded incident, and BC’s own recording policy changed the same day. Maple Ridge’s violent offence count rose 51.5 per cent in that single year, from 1,393 to 2,110. Some of that was a genuine increase and some of it was new counting rules. The province prints its own caution about comparing across that date, and we are printing ours.
The second qualification is more interesting. Recorded offences have barely moved in three years: 6,810 in 2022, 6,798 in 2023, 6,819 in 2024. The rate keeps falling because the population keeps growing. Which is a real improvement in the odds facing any individual resident, and it is not the same thing as less crime happening.
The tension nobody writes about
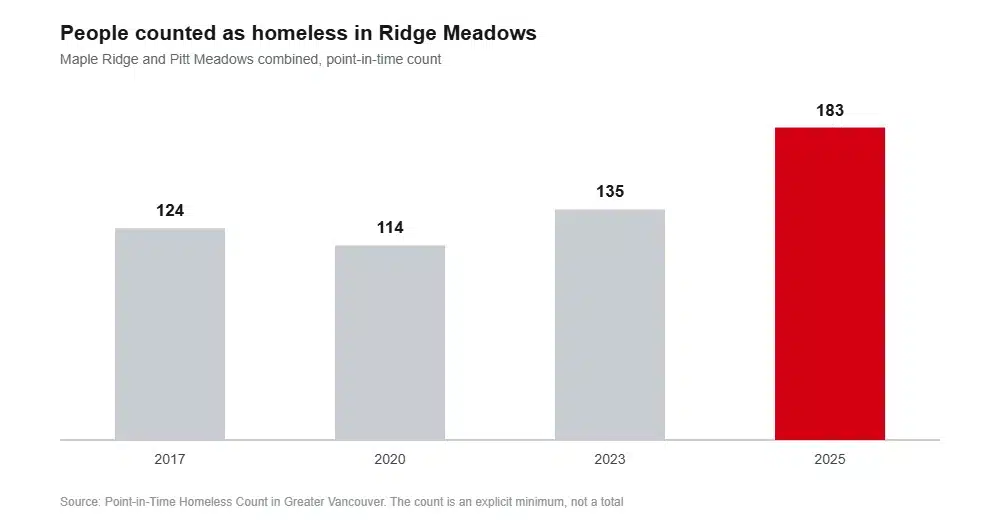
The March 2025 regional count found 183 people experiencing homelessness in Ridge Meadows, up from 135 in 2023. Call that a 35.6 per cent rise against 8.5 per cent across Greater Vancouver as a whole. Within it, the number sleeping unsheltered went from 49 to 78.
The count’s own authors describe their method as producing an absolute minimum rather than a measurement, so treat 183 as a floor. What it establishes is direction, and the direction is up while recorded crime is flat.
That combination explains most of the disagreement you will find locally. It is also why we are not going to tell you the two things are connected. No BC Housing release, city report or RCMP publication we could find contains any data linking supportive housing or homelessness to crime rates or calls for service in either city, in either direction. Anyone who tells you otherwise is working from impression.
What is documented: three Coast Mental Health supportive housing sites operate in Maple Ridge, and a 52-unit permanent building at 11685 Fraser Street opened in August 2024 to replace the temporary modular on Royal Crescent, at roughly $16 million in capital cost with about $1.5 million a year in operating subsidy.
Where the detachment actually spends its time
The last full year of integrated reporting gives a picture most crime articles never show. Across both cities in 2025 the detachment handled 27,164 calls for service, up four per cent, or roughly 75 a day. Of those, 1,711 were mental health calls and 533 were missing person files. Officers made 232 excessive speeding stops, more than half of them for exceeding the limit by 60km/h or more, and removed over 40 impaired drivers.
Volunteers contributed 8,555 hours. The front counter took more than 11,000 walk-in visits.
None of that is a crime rate. Taken together it describes policing here better than any rate does.
You can check your own street
Maple Ridge publishes more open police data than almost any comparable BC city. There is a public crime map covering break and enter, mischief, theft, theft from a vehicle and vehicle theft, defaulting to the last fourteen days and filterable back more than five years. There are ArcGIS dashboards for property and persons crime, and a downloadable property crime dataset.
Markers sit at approximate locations rather than exact addresses, and the map covers property crime only. If you are weighing up a specific block, half an hour on that map will tell you more than any article, including this one.
The risk that is actually higher than average
The intersection speed camera at 207th Street and Lougheed Highway issued 3,012 speeding tickets in 2025, which made it the third busiest in British Columbia. The province’s busiest caught 4,600.
Lougheed Highway runs the length of the city and carries everything: commuters, trucks, and people who have just come off the Golden Ears Bridge. Moving here with new drivers in the house? That is the corridor to talk about.
Frequently asked questions
Is Maple Ridge a high crime area?
Not by BC standards. At 64.0 offences per 1,000 in 2024 it sits about a fifth below the average for cities policed by RCMP municipal detachments, well below Chilliwack at 115.7, Langley City at 103.4 and Mission at 96.7, and slightly above Vancouver at 60.4.
Is Pitt Meadows safer than Maple Ridge?
On the recorded numbers, yes, by 27.7 per cent. It logged 46.3 offences per 1,000 in 2024 against Maple Ridge’s 64.0, and it now has its own detachment with five officers per shift rather than two.
Has crime gone down in Maple Ridge?
Sharply, from 104.3 per 1,000 in 2019 to 64.0 in 2024. The raw count has been flat since 2022, so the improvement is partly the city growing faster than its crime.
Is the homeless situation in Maple Ridge getting worse?
Yes, on the count. March 2025 counted 183 people in Ridge Meadows against 135 in 2023, and the unsheltered share rose from 49 to 78. Anita Place, the tent city on 223rd Street, was cleared in 2019 and the site became a park, and no current primary source documents an active named encampment.
Which part of Maple Ridge has the most crime?
The city’s own crime map is the only honest answer, because no source publishes offence rates by neighbourhood. The map shows property crime concentrated around the town centre and the Lougheed corridor, which is where the shops, the transit and the traffic are.
How we put this together
Every figure comes from the Province of British Columbia, the RCMP, Statistics Canada, BC Housing, the two cities or the regional homeless count, linked where it appears. We have not calculated neighbourhood crime rates, because nobody publishes the population data that would make that honest.
Four cautions we would rather print than bury. The 80.6 benchmark counts only RCMP-served municipalities, not the province. Scoring rules changed on 1 January 2019, so figures either side of that date are not cleanly comparable. The Crime Severity Index for this area could not be extracted from Statistics Canada’s table, which is why no CSI figure appears here. And no published data connects supportive housing to crime in either direction, so we have not implied one.
Sources
- BC Ministry of Public Safety and Solicitor General, Police Resources in British Columbia, 2024
- BC Policing Jurisdiction Crime Trends, 2014 to 2023, Appendix D
- RCMP, de-integration of Ridge Meadows detachment, April 2026
- City of Pitt Meadows, autonomous RCMP detachment
- Ridge Meadows RCMP, 2025 by the numbers
- City of Maple Ridge crime map
- City of Maple Ridge, RCMP property crime open dataset
- 2025 Point-in-Time Homeless Count for Greater Vancouver
- Province of British Columbia, supportive homes on Fraser Street, August 2024
- BC Housing, action on the Maple Ridge supportive housing review
- Statistics Canada, Crime Severity Index by census metropolitan area, 2024
For a comparison next door, Coquitlam came in at 43.2 offences per 1,000 in 2024, Port Coquitlam at 44.0 and Port Moody at 29.2. We have broken the Tri-Cities down the same way, three police services and all.
Weighing up a particular part of town? Our area guide covers what each Maple Ridge neighbourhood is actually like, and the cost breakdown deals with the question most people ask next. When you have settled on an address, tell us where you are moving from.
