

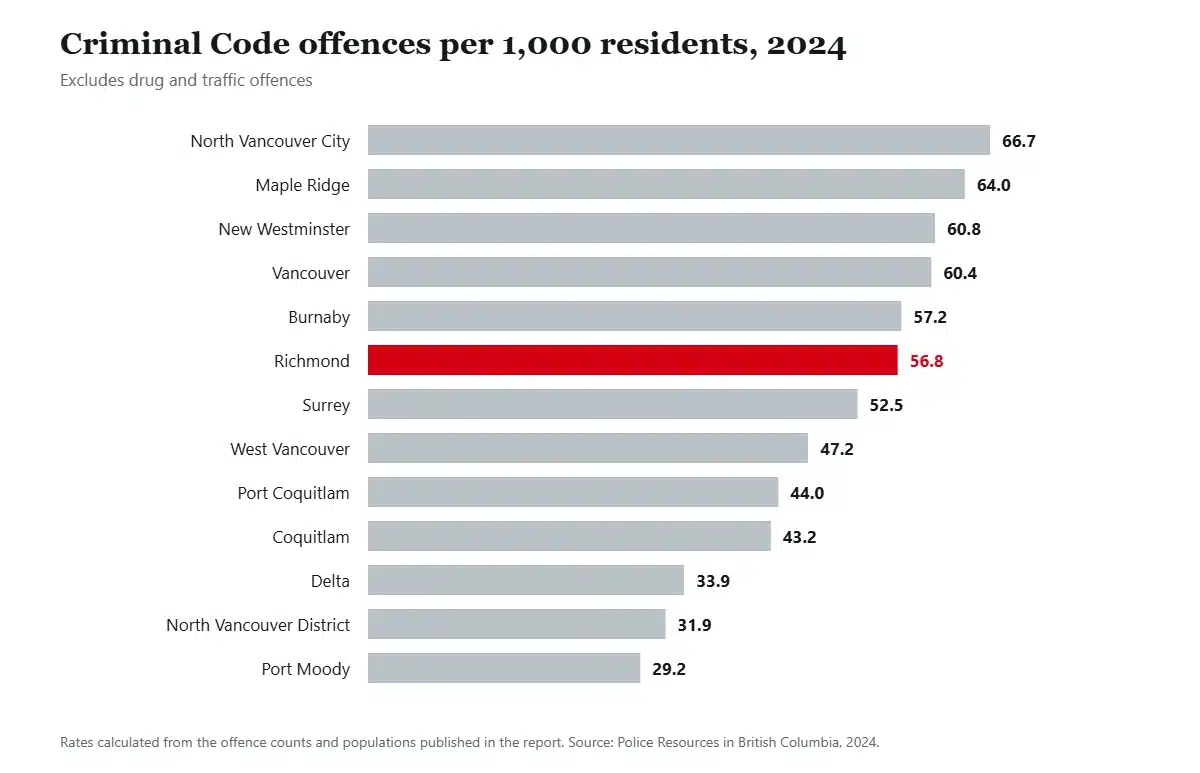
Richmond recorded 56.8 Criminal Code offences per 1,000 residents in 2024. Across thirteen Metro Vancouver municipalities that puts it sixth, below Vancouver, New Westminster and Burnaby, and above Surrey, Delta and Port Moody. Squarely mid-pack.
Before anyone quotes a higher number at you, know where the higher numbers come from. Provincial figures divide 13,798 offences by 242,965 residents, which is the BC Stats estimate it uses throughout. Census counts for Richmond run materially below that, and dividing the same offence total by a census-scale population pushes the rate into the mid-sixties and moves Richmond from sixth place to second. Same crime, different denominator.
The short version
- 56.8 per 1,000 in 2024, sixth of thirteen Metro Vancouver municipalities.
- The rate fell 4.9 per cent over the decade while the offence count rose 10.2 per cent, because the population grew faster than the crime.
- Richmond’s is a property crime profile. Property offences run about three and a half times violent ones.
- Vancouver International Airport is policed through the Richmond detachment, but its officers and its costs are excluded from Richmond’s figures. Whether its offences are is not published anywhere.
- The only peer-reviewed study of crime along the Canada Line used Richmond RCMP data and found reported crime fell after the line opened.
- Nobody publishes crime statistics for Steveston, or for any other Richmond neighbourhood. Any ranking you find was invented.
Where it actually sits
| Richmond, 2024 | Figure |
|---|---|
| Police service | RCMP municipal unit |
| Population | 242,965 |
| Criminal Code offences | 13,798 |
| Rate per 1,000 | 56.8 |
| Authorized officers | 292 |
| Residents per officer | 815 |
| Files per officer | 46 |
| Policing cost per resident | $325 |
Source: Police Resources in British Columbia, 2024, published December 2025.
That $325 is worth a moment. Richmond pays less per resident for policing than Vancouver at $606, Delta at $401 or New Westminster at $397, and more than Coquitlam at $246 or Burnaby at $288. Its officers carry 46 files each, which is heavier than Vancouver’s 32 and lighter than Burnaby’s 53.
A decade of numbers, and the trap in them
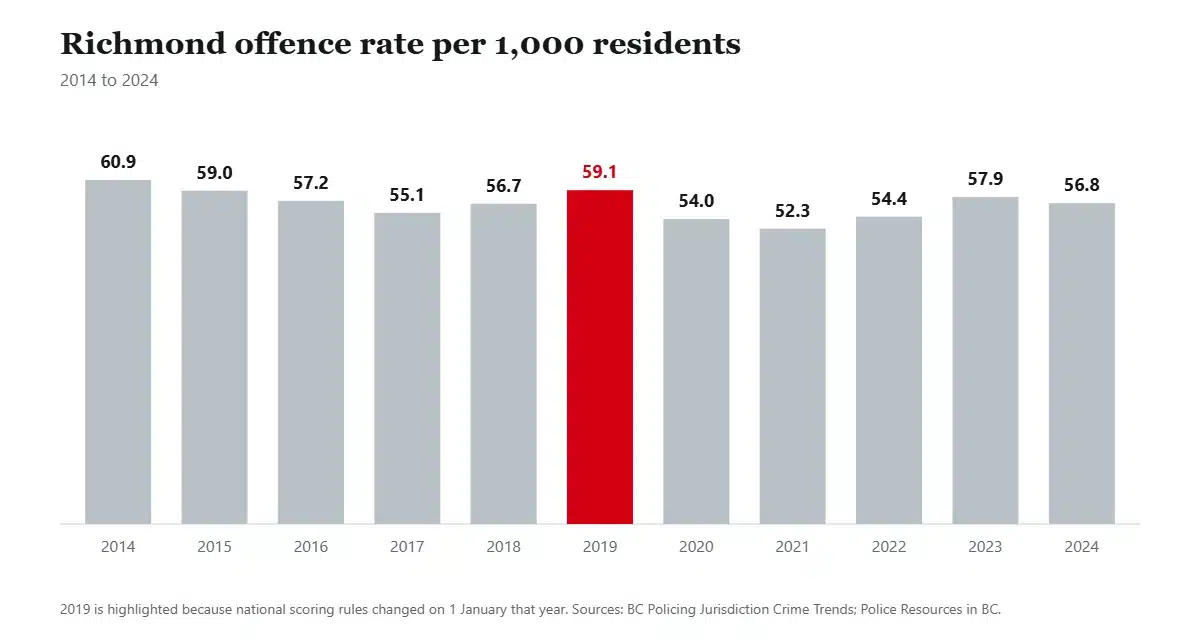
Richmond’s rate went from 60.9 in 2014 to a low of 52.3 in 2021 and back to 57.9 in 2023, a net fall of about five per cent across the decade. Over the same period the offence count rose ten per cent and the population rose sixteen. So more crime happened and less of it happened to any given person, which is what growth looks like.
Two things to hold onto. The 2021 low sits inside pandemic restrictions that suppressed offending and emptied the airport, so it is not a baseline. And the 2022 and 2023 rises are real, but 2023 still came in below 2014.
Now the part almost every safest-cities article skips. Richmond’s violent offence count jumped from 1,653 in 2018 to 1,963 in 2019, up 18.8 per cent, while the total count rose only 5.7 per cent. Violent crime’s share of the total stepped from 13.8 per cent to 15.5 and never went back.
What happened on 1 January 2019 is that police forces across the country adopted revised scoring rules, and the province says so in the appendix itself: agencies implemented the changes in January 2019, which may have affected BC’s crime data for that year. Any claim that violent crime in Richmond is up some large percentage since 2018 is carrying a definitional change inside it. Comparisons within 2014 to 2018, or within 2019 to 2023, are sound. Across that line they are not.
What the crime here actually is
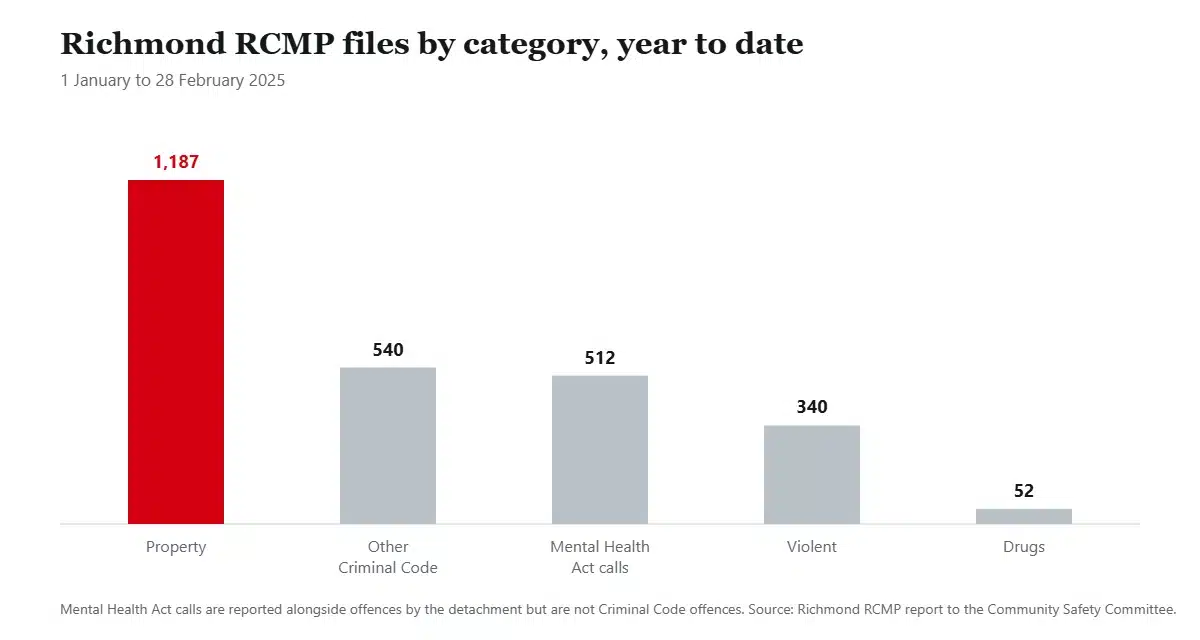
Property files ran about three and a half times the violent count. If you are moving here and worrying about something, worry about your car and your garage rather than your street.
The detail underneath is more encouraging than the headline. February 2025 property crime came in below its five-year average, while violent crime came in above its own. Drug files rose 58 per cent year on year from a small base, and Mental Health Act calls rose 14 per cent, which is a policing workload story rather than a crime story.
On retail theft, the detachment is explicit that it is a continuing issue in the downtown core. A single-day enforcement operation on 18 October 2025, funded through the province’s Community Safety and Targeted Enforcement Program, produced fifteen arrests and recovered more than $5,000 of merchandise. Most of those arrested came from other jurisdictions. In a city with Richmond Centre, Aberdeen, Lansdowne and the outlet mall by the airport, that is not a surprise, and it is a real part of why the property number looks the way it does.
The airport question
Richmond contains Vancouver International Airport, which handled 26.2 million passengers in 2024 and a record 26.9 million in 2025. Roughly 108 passenger movements a year for every Richmond resident, which is our arithmetic on two published figures rather than anybody’s official statistic.
Here is what is actually established. Thirty-four RCMP member positions are dedicated to airport security and are administered through the Richmond detachment. Their strength and their cost are explicitly excluded from Richmond’s municipal figures, because the Vancouver Airport Authority reimburses the full amount. Airport policing cost $7,499,042 in 2024, and none of it lands on a Richmond tax notice.
Here is what is not established. The report says nothing about where airport offences are counted. We could not find any source, provincial or federal, that states whether a Criminal Code incident at YVR sits inside Richmond’s 13,798 or outside it.
So we are not going to tell you the airport inflates Richmond’s crime rate. Nobody has published the thing that would make that true, and if airport offences are excluded the way airport officers are, it would not be true at all. What we will say is that Richmond’s rate is measured against its residents, and the city hosts an enormous number of people who are not among them. That is worth knowing when you compare Richmond to a purely residential suburb.
The Canada Line question
This is the one people ask about, and Richmond is the rare place where there is an actual answer.
A peer-reviewed study published in the Security Journal analysed Richmond RCMP data from January 2006 to August 2011, covering a 250-metre buffer around seven Canada Line stations, using time-series regression. It found that reported crime decreased after the line became operational. The whole point of the paper was to test the common assumption that rapid transit imports crime, and the data did not support it.
Two caveats and we will leave it there. The study window ends in August 2011, so it describes the years around the line’s opening rather than conditions today. We could also find no station-level crime statistics published by Metro Vancouver Transit Police, so nobody can tell you what happens at Bridgeport or Lansdowne now.
Neighbourhoods, and why we are not ranking them
There are no published crime statistics for any part of Richmond. The detachment’s monthly report to council is city-wide only, with no breakdown by district or neighbourhood. The city’s criminal activity map plots approximate points for six property crime categories, and carries its own disclaimer that locations are approximate and the material is provided without any representation of completeness or accuracy.
That is the entire public record. So when a page ranks the safest neighbourhoods in Richmond, or tells you how Steveston compares to City Centre, it is not using police data, because police data at that granularity does not exist.
Cars, roads and the tunnel
Auto crime across British Columbia has fallen a long way. ICBC’s ten-year data to 2025 shows auto crime down 31 per cent in total since 2016, vehicle break-ins down 60 per cent with a noticeable drop from 2023, and stolen vehicles down 46 per cent. Those are provincial figures and we are not going to pretend they are Richmond’s, because ICBC’s municipal breakdown is served through a dashboard we could not extract.
The bigger change to Richmond’s roads is under construction. The George Massey Tunnel, four lanes and open since 1959, is being replaced by an eight-lane toll-free immersed tube tunnel running between Bridgeport Road in Richmond and Ladner Trunk Road in Delta, due to open in 2031. The Steveston Interchange opened in 2025 as part of the same programme. Anyone moving to south Richmond should expect years of construction on the Highway 99 corridor.
The risk that is actually measured here
Richmond is a delta city averaging about a metre above sea level, held by 49 kilometres of dikes and 39 drainage pump stations that can move roughly 1.4 million US gallons a minute. The city is raising its dikes from 3.5 metres to 4.7 to stay ahead of sea level rise, and has rebuilt 19 pump stations since the early 2000s, adding 30 per cent to total capacity.
Money is going in. A $13 million project completed with federal and provincial funding rebuilt the No. 3 Road South drainage pump station, quadrupling its capacity, and built more than 1,200 metres of dike to year-2100 flood design levels, protecting over 29,000 residents, about fifty businesses and eight square kilometres of farmland.
All of which is the honest framing for anyone weighing risk in Richmond. The crime numbers are mid-pack and improving. The thing the city spends its engineering budget on is water.
One more piece of context that explains the shape of the place: about 39 per cent of Richmond’s land base, roughly 4,993 hectares, sits inside the Agricultural Land Reserve, farmed by 184 farms. That is why a city of nearly a quarter of a million people has a dense City Centre and a great deal of open ground around it.
Frequently asked questions
Is Richmond BC a safe place to live?
On the published numbers, about average for Metro Vancouver: 56.8 offences per 1,000 residents in 2024, sixth of thirteen municipalities, with a rate that has fallen slightly over the decade. It is a property crime city rather than a violent one, at roughly three and a half property offences for every violent one.
Which is the safest neighbourhood in Richmond?
Nobody can tell you honestly. Richmond RCMP publish city-wide totals only, and the city’s crime map is a plot of approximate points for six property offence types rather than a statistical series. There is no published neighbourhood crime data for Richmond at all.
Does the airport make Richmond’s crime rate look worse?
It might, and it might not. The province excludes the airport’s 34 RCMP positions and its $7.5 million policing cost from Richmond’s figures because the Airport Authority reimburses them, but it does not say where airport offences are counted. Until somebody publishes that, the claim cannot be made either way.
Did the Canada Line bring crime to Richmond?
No, on the only peer-reviewed evidence that exists. Using Richmond RCMP data from 2006 to 2011 within 250 metres of seven stations, it found reported crime decreased after the line opened. That evidence is now fifteen years old, and no newer station-level data has been published.
Why do some sites say Richmond’s crime rate is over 65?
Because they divided the offence count by a census population instead of the BC Stats estimate the province actually uses. That single swap moves Richmond from sixth place to second. The province publishes 13,798 offences against a population of 242,965.
How we put this together
Figures come from the Province of British Columbia, the Richmond RCMP’s own reporting to the city’s Community Safety Committee, Statistics Canada, ICBC, the Vancouver Airport Authority and the City of Richmond, linked where they appear.
Four cautions we would rather print than bury. The 2019 scoring change makes violent crime figures either side of that date incomparable, and we have said so where it matters. We have not published a Crime Severity Index for Richmond, because Statistics Canada’s municipal table renders dynamically and would not open, and we would rather leave a gap than take a number from an aggregator. Nor have we localised ICBC’s provincial auto crime figures. And we have not told you the airport inflates the rate, because no published source establishes it.
Sources
- BC Ministry of Public Safety and Solicitor General, Police Resources in British Columbia, 2024
- BC Policing Jurisdiction Crime Trends, 2014 to 2023, Appendix D
- Richmond RCMP, report to the Community Safety Committee, February 2025
- City of Richmond, criminal activity map
- Richmond RCMP, retail theft enforcement operation, October 2025
- Statistics Canada, Crime Severity Index by census metropolitan area, 2025
- Gallison, the line of crime, Security Journal, 2016
- ICBC, ten-year auto crime data, May 2026
- Vancouver Airport Authority, 2024 sustainability report
- City of Richmond, flood protection and dikes
- City of Richmond, agriculture and the Agricultural Land Reserve
- Province of British Columbia, Highway 99 Tunnel Program
Weighing up a particular part of the city? Our area guide covers what each neighbourhood is actually like, the cost breakdown deals with the question most people ask next, and the wider case for and against weighs the whole thing up. When you have settled on an address, tell us where you are moving from.
