

Last updated: August 2026 · Every figure below is dated and attributed to its source
Search “Mission BC crime rate” and you will be handed a number: 95.5. Nearly every article about crime in this area quotes it.
It is not Mission’s number.
That figure is the Crime Severity Index for the Abbotsford–Mission census metropolitan area, a Statistics Canada geography that blends two municipalities policed by two entirely different forces, in which Abbotsford’s population is nearly four times Mission’s. Quoting it as Mission’s crime severity is the single most common error made about this town.
Here is what the data actually says about Mission, where it comes from, and what nobody publishes at all.
The short answer
The most recent Mission-specific figure from a government source is from the Province’s Police Resources in British Columbia, 2024:
| Mission (RCMP municipal jurisdiction), 2024 | |
|---|---|
| Population | 46,606 |
| Criminal Code offences | 4,507 |
| Crime rate | 97 per 1,000 residents |
| Authorised officers | 53 (58 adjusted for integrated teams) |
| Population per officer | 806 |
| Case load per officer | 78 offences |
| Policing cost | $16,849,612 — $362 per resident |
Source: BC Ministry of Public Safety and Solicitor General, Police Resources in British Columbia, 2024 (published December 2025).
For context, British Columbia’s overall crime rate was 74.0 per 1,000 in 2023. Mission runs meaningfully above the provincial average.
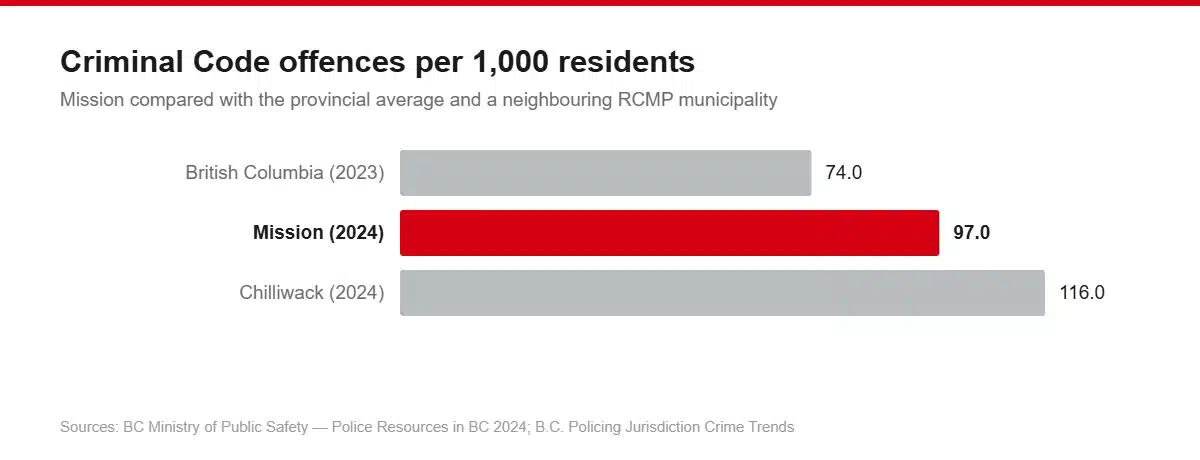
Within the same table (other RCMP-policed municipalities, same definition, same year), Chilliwack recorded 116 per 1,000. So Mission sits above the province and below Chilliwack.
A comparison to make carefully: Abbotsford recorded 55 per 1,000 in the same report. But Abbotsford has its own independent municipal police department and appears in a different table, covering a different policing model. The two numbers are not wrong, and they are not quite like-for-like either.
Why the number you’ll see quoted isn’t Mission’s
This is worth understanding properly, because it explains most of the confusion online.
Statistics Canada’s headline release on 22 July 2026 reported the Abbotsford–Mission CMA at a Crime Severity Index of 95.5, down 1%, with a crime rate of 6,717 per 100,000, up 4%. Canada’s CSI was 75.0; British Columbia’s was 92.4.
That CMA figure combines:
- Abbotsford: population about 175,000, policed by the Abbotsford Police Department, an independent municipal force
- Mission: population about 46,600, policed by the RCMP
- The rural areas between them
Abbotsford is roughly 3.8 times Mission’s size, so the blended number is dominated by Abbotsford. Two different police services with different reporting practices are being averaged together and then attached to both names.
Statistics Canada does hold Mission as its own reporting geography. It appears in the national tables as “Mission, British Columbia, Royal Canadian Mounted Police, municipal.” But that figure is not surfaced in the headline release, in the news coverage, or anywhere a normal person would find it.
The trend, which is the more useful view
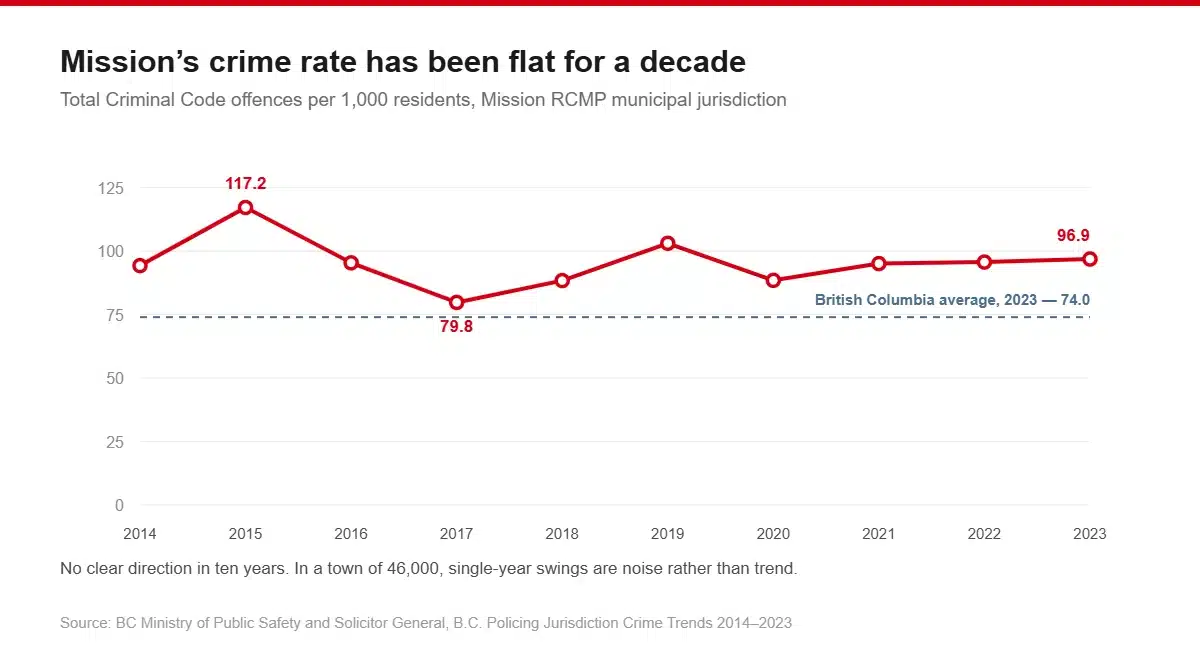
The BC Ministry of Public Safety publishes municipal-level crime rates going back a decade. For the Mission RCMP municipal jurisdiction, total Criminal Code offences per 1,000 residents:
| Year | Rate per 1,000 |
|---|---|
| 2014 | 94.3 |
| 2015 | 117.2 |
| 2016 | 95.4 |
| 2017 | 79.8 |
| 2018 | 88.4 |
| 2019 | 103.1 |
| 2020 | 88.5 |
| 2021 | 95.1 |
| 2022 | 95.7 |
| 2023 | 96.9 |
Source: BC Ministry of Public Safety and Solicitor General, B.C. Policing Jurisdiction Crime Trends 2014–2023.
What that shows is a town that has been broadly flat for a decade, bouncing in a band between about 80 and 117 with no clear direction. It is not improving the way Langley’s and Abbotsford’s numbers have. It is not deteriorating either.
Be careful with single-year comparisons here. In a town of 46,000, the swing from 117.2 in 2015 to 79.8 in 2017 is a 32% drop in two years. That is small-number volatility, not a policy success or a crime wave.
Violent crime
The same source publishes violent Criminal Code offences for Mission as counts, not rates:
| Year | Violent offences |
|---|---|
| 2014 | 538 |
| 2019 | 885 |
| 2023 | 1,011 |
That is close to a doubling in count over a decade, during which Mission’s population also grew substantially. Because the province does not publish a violent crime rate for Mission, and we do not have a reliable annual population series to divide by, we are not going to calculate one. Anyone who quotes you a “Mission violent crime rate” has derived it themselves. Ask what denominator they used.
What Mission RCMP reported for 2025
Mission RCMP reported to council in May 2026 that police files rose from 15,435 in 2024 to 16,496 in 2025, a 7% increase.
Within that:
- Missing persons +46%
- Shoplifting +37%
- Residential break and enter +15%
- Mental Health Act files +8%
- Mischief +7%, property crime +6%, violent crime +2%
- Down: other break and enter −48%, theft over $5,000 −21%, arson −15%
About 48% of 2025 files were chargeable offences.
Do not put “files” and “Criminal Code offences” in the same sentence. Mission RCMP counted 16,496 files in 2025; the province counted 4,507 Criminal Code offences in 2024. They are roughly 3.7 times apart because “files” includes missing persons, Mental Health Act calls and general assistance, things that are not crimes. Both numbers are correct. They measure different things.
What nobody publishes
Being direct about the gaps is more useful than filling them with something that looks authoritative.
- There is no Mission crime map. Not from Mission RCMP, not from the City, not from the province. Abbotsford has one. Vancouver has one. Mission does not.
- There is no neighbourhood-level crime data for Mission. The finest geography anyone publishes officially is the whole municipality. So there is no answer to “which is the safest neighbourhood in Mission”, not a hidden one, simply none.
- Mission RCMP publishes no annual report and no response times. The only detachment document the City links is a 2023–2027 strategic plan, which is a strategy, not statistics.
- There is no 2024 or 2025 municipal crime rate from the province. The BC jurisdiction series stops at 2023, so the most recent official Mission crime rate is three years old, apart from the 2024 figure in the police resources report.
Sites that show you “crime rates by Mission neighbourhood” are modelling estimates from municipal totals. They are not police data. Treat them accordingly.
One more thing worth flagging: the City of Mission’s own strategic-plan dashboard claims Mission is “the third safest community in the Fraser Valley.” No figure, no year and no source is given for that claim anywhere on the page. We could not substantiate it, so we are not repeating it as fact.
What the numbers don’t cover
Homelessness has risen sharply and then plateaued. The Fraser Valley Regional District’s point-in-time counts found:
| Year | People counted in Mission |
|---|---|
| 2014 | 75 |
| 2017 | 63 |
| 2020 | 178 |
| 2023 | 175 |
In 2023, 96 were sheltered and 79 unsheltered. Mission accounted for 16% of the regional total of 1,094. The near-tripling between 2017 and 2020 is the striking part, and visible street homelessness in the downtown core is what a lot of people are actually reacting to when they ask whether Mission is safe.
Policing capacity. Mission has 53 authorised officers, 58 adjusted, for 46,606 people: one officer per 806 residents, carrying 78 files each. Whether that feels adequate depends on where in a 225-square-kilometre municipality you live, and Mission’s rural north is a long way from the detachment on Oliver Street.
The incidents people remember
Specifics are more useful than reassurance.
24 May 2026: homicide investigation. A woman was found dead in a residence in the 33600 block of Dewdney Trunk Road; a man with non-life-threatening injuries was also present and taken to hospital. The Integrated Homicide Investigation Team took carriage of the file.
21 December 2024: targeted shooting. A 57-year-old man was shot and airlifted with non-life-threatening injuries, found inside a houseboat near Duncan Avenue and Wren Street by the Fraser River. Two suspects fled. RCMP described it as targeted, with no ongoing risk to the public.
Both were investigated as isolated incidents. Neither reflects a pattern the data supports.
So, is Mission safe?
If you want the number: Mission’s crime rate is 97 per 1,000 residents, against a BC average of 74.0. It has been broadly flat for a decade. Property crime is the dominant category, as it is almost everywhere in Canada, and shoplifting and residential break-and-enter both rose sharply in 2025.
If you want the judgement: Mission is an ordinary small BC city on crime, running somewhat above the provincial average, with a property crime problem that is the realistic risk for most residents and a visible street-homelessness situation downtown that shapes how the place feels more than the statistics do.
What Mission does not have is transparency. Abbotsford publishes a crime map and an annual report. Langley City publishes a monthly property crime map. Mission publishes neither, and the provincial data about it is three years stale. If you want to understand a specific street here, you will have to go and stand on it, because no dataset will tell you.
Frequently asked questions
What is Mission BC’s crime rate?
97 Criminal Code offences per 1,000 residents in 2024, from the Province’s Police Resources in British Columbia report. BC’s overall rate was 74.0 per 1,000 in 2023.
Is the Crime Severity Index of 95.5 Mission’s?
No. That is the Abbotsford–Mission census metropolitan area for 2025, a blended figure covering both municipalities and two different police forces, in which Abbotsford is about 3.8 times Mission’s size. It should not be described as Mission’s crime severity index.
Is Mission safer than Abbotsford or Chilliwack?
Safer than Chilliwack on the province’s own comparison of RCMP-policed municipalities: 97 per 1,000 against 116 in 2024. Abbotsford recorded 55, but it has an independent municipal police department and appears in a separate table, so that comparison is less direct.
Which are the safest neighbourhoods in Mission?
Nobody publishes crime data by Mission neighbourhood: not the RCMP, not the City, not Statistics Canada. There is no crime map for Mission at all. Any site ranking Mission neighbourhoods by safety is estimating from municipal totals.
Is crime in Mission getting worse?
Mission RCMP reported police files up 7% from 2024 to 2025, with shoplifting up 37% and residential break-ins up 15%. The longer provincial series shows the crime rate broadly flat between 2014 and 2023, moving in a band without clear direction.
How many police officers does Mission have?
53 authorised officers in 2024, or 58 adjusted for regional integrated teams, one officer per 806 residents, at a policing cost of $362 per resident.
Sources
The full provincial crime table shows how Mission compares with every other BC municipality.
Just west along the Fraser, Maple Ridge and Pitt Meadows record markedly lower rates, and their detachment split into two in April 2026.
Moving to Mission? We can take care of the move itself — local, or from anywhere in the province.
