

Last updated: August 2026
Ask whether Langley is safe and you’ll get two answers that both look authoritative and completely contradict each other. One says Langley’s crime severity is nearly double the national average. The other says it’s below it.
Both are correct. They’re describing different municipalities that happen to share a name.
The two numbers
| Crime Severity Index, 2025 | |
|---|---|
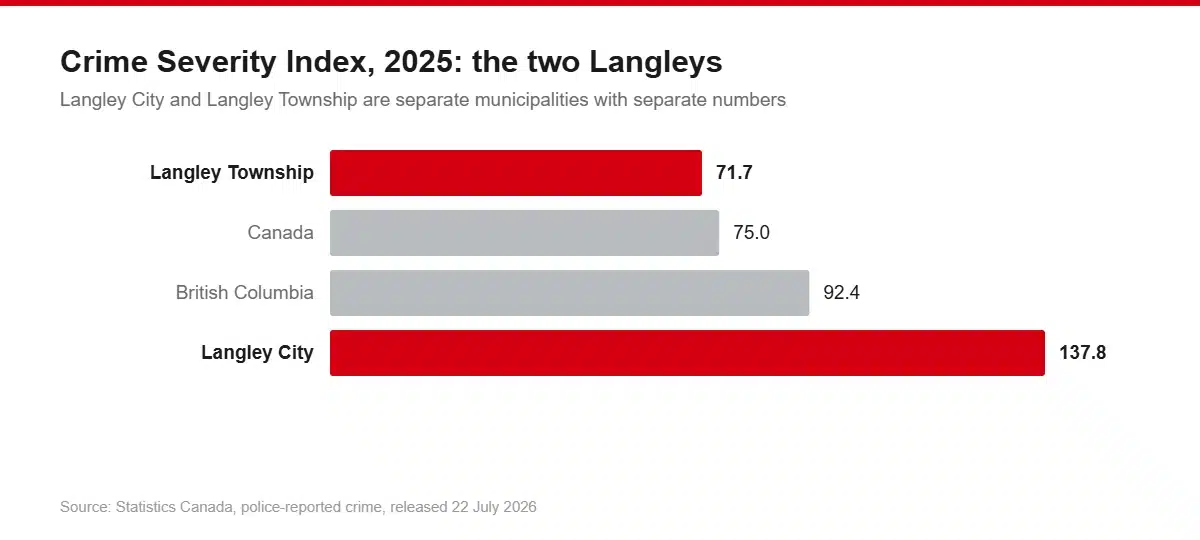
| Langley City | 137.8 (up 25.8% on 2024) |
| Langley Township | 71.7 (down 8.9% on 2024) |
| British Columbia | 92.4 (down 1.6%) |
| Canada | 75.0 (down 4.9%) |
Source: Statistics Canada 2025 police-reported crime, released July 2026.
Langley City’s CSI is roughly 49% above the BC average and 84% above the national average. Langley Township’s is 22% below BC and slightly below Canada.
The City’s index is 1.92 times the Township’s.
If someone tells you “Langley’s crime rate is terrible” or “Langley is really safe,” ask them which Langley they mean. There’s a good chance they don’t know there are two.
Why the gap is so large
The obvious explanation, that Langley City is a rough place and the Township isn’t, is not really what’s going on.
Langley City is 10 square kilometres. Inside those 10 km² sit the regional shopping district, the bus exchange, Cascades Casino, the downtown core, and a concentration of supportive housing. It serves a catchment many times its own 35,000 residents.
Crime is counted where it occurs, not where the people involved live. So a 10 km² town centre absorbs the police-reported incidents generated by a region of nearly 200,000 people, and then that total gets divided by the City’s own small population. The rate comes out high by arithmetic as much as by anything else.
This isn’t a defensive theory invented locally. Eleven Western Canadian municipalities, including Langley City, met with Statistics Canada in Saskatoon in February 2024 to press for changes in how the data is released, and StatCan implemented changes for its July 2024 release.
Langley City’s mayor, Nathan Pachal, has put it bluntly: crime rates and Crime Severity Index data “should not be used to rank municipalities against one another, as it is an incorrect use of this data.”
Two data problems you should know about
First: any Langley City crime figure from before 2023 is unreliable. A large number of “making or distribution of child pornography” incidents were misattributed to Langley City in the data between 2015 and 2022. It was corrected from 2023 onward. If you find an alarming Langley City CSI on a comparison website, check the year, since there’s a real chance it’s inflated by a data-entry error.
Second: the 2025 spike in the City’s violent CSI comes off a tiny base. The City’s violent CSI rose 75.7% in 2025. Part of that is two homicides in 2025 against one in 2024. When your baseline is one, a second incident is a 100% increase. Small-number volatility is not a trend.
The trend, which is better than the headline
Both Langleys have got steadily safer over the period where we have consistent municipal data. From the BC Ministry of Public Safety’s policing jurisdiction figures:
Langley City — total Criminal Code offences per 1,000 people
| Year | Rate |
|---|---|
| 2019 | 197.0 |
| 2020 | 163.5 |
| 2021 | 165.6 |
| 2022 | 157.0 |
| 2023 | 130.6 |
Langley Township — total Criminal Code offences per 1,000 people
| Year | Rate |
|---|---|
| 2019 | 78.0 |
| 2020 | 69.3 |
| 2021 | 63.3 |
| 2022 | 60.6 |
| 2023 | 56.3 |
The City’s crime rate fell 33.7% over five years. The Township’s fell 27.8%. Neither had a single year where it went up.
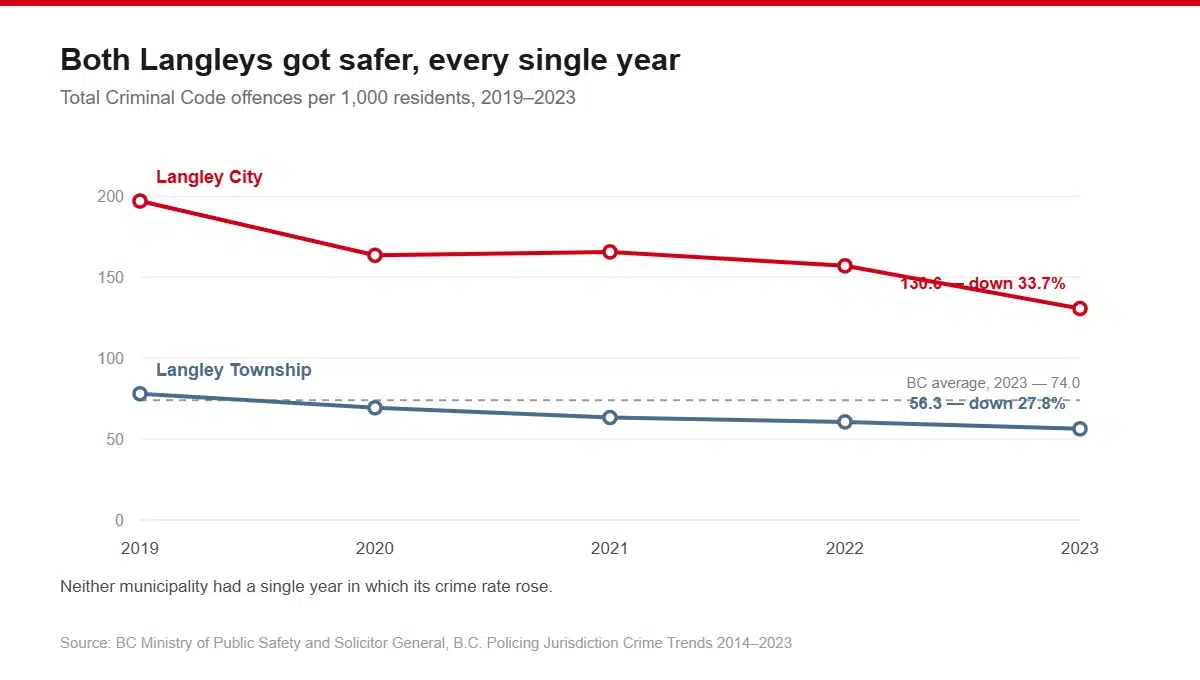
For reference, BC’s overall crime rate in 2023 was 74.0 per 1,000, so the Township was running 24% below the provincial average while the City ran 76% above it.
Violent versus property crime
Langley City, 2023: violent crime 22.1 per 1,000, property crime 56.1 per 1,000.
Langley Township, 2023: violent crime 10.9 per 1,000, property crime 24.1 per 1,000.
So the City’s violent rate was about 2.0 times the Township’s and its property rate about 2.3 times.
One nuance in the Township’s numbers worth flagging: its violent offence count rose from 1,530 in 2019 to 1,694 in 2023, while the rate fell from 11.6 to 10.9. Population grew faster than incidents. Both statements are true and people use whichever suits their argument.
Property crime is the dominant category in both municipalities, as it is almost everywhere in Canada. It’s what actually happens to most residents.
Is there a Langley crime map?
Partly.
Langley City publishes a monthly property crime map. It’s updated monthly and available through the City’s public safety pages at langleycity.ca. It covers property crime, City of Langley only.
The Township has a “Property Crimes” dataset on its ArcGIS open data portal. The granularity, time period and update frequency aren’t documented on the public metadata page, and the associated web mapping application is marked retired.
Langley RCMP publishes no crime statistics, crime map or neighbourhood breakdown at all. Both the detachment page and the Township’s RCMP page offer contact details and online crime reporting, nothing more.
So: there is no published crime rate for Walnut Grove, Willoughby, Fort Langley, Murrayville, Brookswood, Aldergrove or the rural area individually. The smallest official unit is the municipality.
Any website showing you “crime rates by Langley neighbourhood” or “the worst neighbourhoods in Langley” is modelling or scraping, not reporting police data. Don’t make a housing decision on it.
A policing change that matters
The joint City/Township RCMP detachment was de-integrated on 10 May 2025, after a Township council resolution in 2023 and a two-year notice period. Each municipality now runs its own detachment. The Township owns the building; the City is using it transitionally at market rates while it finds its own.
The staffing picture is worth knowing about: authorised strength across both is 222 officers, but actual deployed strength in 2025 was around 162, down from 178 in 2023, and attributed to extended leaves, retirements and delayed replacements. That’s a roughly 60-officer gap between what’s funded and what’s on the road.
The incidents people remember
Being specific about these is more useful than vague reassurance.
25 July 2022: the Langley shootings. Four people were shot at five locations across both the City and Township between roughly midnight and 7:20am: the Cascades Casino parking lot, a supportive housing site at 200 Street and 64 Avenue, the Langley bus loop, and twice near the Langley Bypass. Two men were killed and two people wounded. Three of the four victims were homeless. The perpetrator died in a shootout with police. Two provincial emergency alerts were issued that morning.
It was a genuinely frightening event and it shaped how a lot of people still think about Langley. It was also four years ago and singular.
18 April 2025: a homicide in the Township, 20500 block of 56 Avenue. IHIT stated: “We are believing this was an isolated incident and there is no ongoing risk to the public.”
May 2026: two shootings at the same Langley City address, ten days apart on Brydon Crescent. One man was injured on 16 May; a man in his 40s died on 26 May. A suspect was arrested on 30 May and charged with second-degree murder. Police said the men knew each other and described it as targeted and isolated.
Extortion. BC set up a 40-member RCMP-led provincial extortion task force in September 2025, targeting extortion against the South Asian community, with Metro Vancouver and Surrey named as the most affected areas. Langley isn’t named in that release. One Langley resident’s case, reported in 2024, resulted in a US federal charge against a California man in late 2025 after Langley RCMP worked with the FBI.
April 2026: residents of the High Point Equestrian Estates subdivision in the rural Township asked to become a gated community, citing burglaries, an extortion incident, stunting and long police response times given their location. No incident counts were provided.
That last one points at something real: in a 316-square-kilometre municipality, the rural parts have a genuine response-time problem that no crime statistic captures.
So, is Langley safe?
The Township is, by any normal reading. Its 2025 crime severity index of 71.7 is below both the provincial and national averages, its crime rate has fallen every year since 2019, and at 56.3 offences per 1,000 residents it sits well under BC’s 74.0.
Langley City is a more complicated answer. Its index is genuinely high, 137.8 against a national 75.0, and it went up in 2025 while the Township’s went down. But its own crime rate dropped by a third between 2019 and 2023, and a meaningful share of what’s counted there is generated by a regional catchment rather than by its residents.
The practical version: property crime is the realistic risk in both municipalities, and it’s the thing to actually plan around. Secure your vehicle, your garage and your packages. If you’re looking at a specific street in the City, the monthly property crime map is the tool. If you’re looking at the rural Township, ask about response times rather than crime rates.
And be careful with any source that says “Langley” without saying which one.
Frequently asked questions
What is Langley’s crime rate?
Depends which Langley. In 2023, Langley City recorded 130.6 Criminal Code offences per 1,000 residents and Langley Township recorded 56.3. BC’s provincial rate that year was 74.0.
Why is Langley City’s crime rate so much higher than the Township’s?
Langley City is 10 km² containing the regional shopping district, bus exchange, casino, downtown and a concentration of supportive housing, serving a catchment far larger than its own 35,000 residents. Crime is counted where it happens, then divided by resident population. Eleven Western Canadian municipalities, Langley City among them, raised this with Statistics Canada in 2024.
Is Langley crime getting worse?
The Township’s crime severity fell 8.9% in 2025; the City’s rose 25.8%. Over the longer run both improved substantially: the City’s crime rate fell 33.7% and the Township’s 27.8% between 2019 and 2023, with no increase in any single year.
What are the safest neighbourhoods in Langley?
Nobody publishes crime data by Langley neighbourhood. Langley RCMP publishes no statistics at all; Langley City publishes a monthly property crime map for the City only; the Township has an undocumented open-data property crime dataset. Sites ranking Langley neighbourhoods by safety are estimating.
Is Aldergrove safe?
There is no published crime rate for Aldergrove specifically, or for any individual Langley community. Aldergrove is in the Township, whose overall 2025 crime severity index of 71.7 sits below both the BC and national averages.
Was there a shooting in Langley?
Yes. Most notably on 25 July 2022, when four people were shot at five locations across the City and Township; two died and the perpetrator was killed by police. There have been isolated incidents since, including a fatal shooting in Langley City in May 2026 that police described as targeted.
The provincial crime table shows how both Langleys compare with the rest of BC.
Across the Golden Ears Bridge, Maple Ridge and Pitt Meadows both come in well below the Langley City figure.
Whichever Langley you end up in, here’s how we move people across the City and the Township.
