

New Westminster recorded 60.8 Criminal Code offences per 1,000 residents in 2024. That is almost exactly Vancouver’s number, and lower than Maple Ridge or the City of North Vancouver.
Which is not the answer most people expect, and it comes with a wrinkle worth knowing before anyone quotes a different figure at you. Our figure uses BC Stats’ population estimate of 92,435. Run the same 5,623 offences against the 2021 census count of 78,916 and you get 71.3, which is about 17 per cent higher and completely wrong. A lot of what circulates about this city is that arithmetic error.
The short version
- 60.8 per 1,000 in 2024, third of eleven Metro Vancouver municipalities we compared, and within noise of Vancouver at 60.4.
- Offence rates have fallen about a quarter since 2014 while the population grew by nearly a third.
- New Westminster runs its own police department, one of only twelve in British Columbia, and pays $397 per resident for it.
- Theft from vehicles fell 44 per cent in two years, from 704 in 2022 to 397 in 2024.
- Nobody publishes crime statistics by SkyTrain station or by neighbourhood. Any guide that ranks New Westminster neighbourhoods by safety made it up.
- The police department’s own most recent stated concern is not crime. It is pedestrians being hit by cars.
Where it actually sits
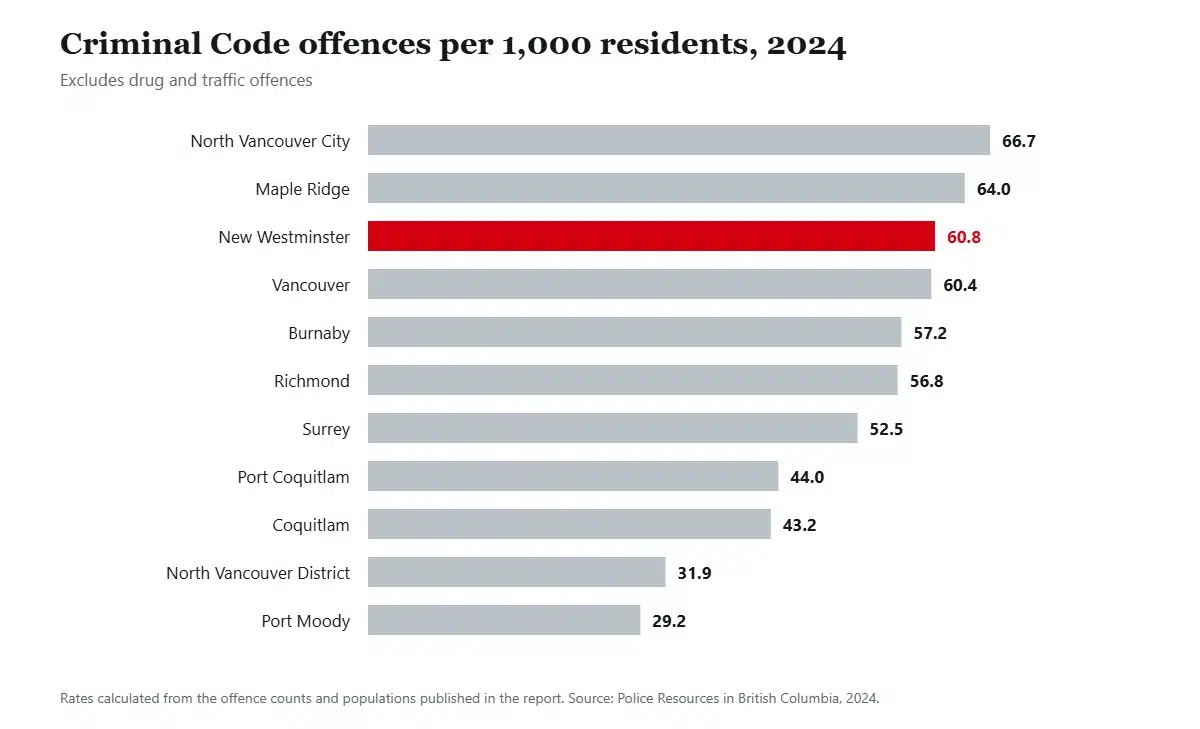
Third of eleven, in a dead heat with Vancouver, below the City of North Vancouver at 66.7 and Maple Ridge at 64.0, and roughly double Port Moody at 29.2. Call it a mid-to-upper urban rate rather than an outlier.
These are printed as whole numbers by the province, with a warning next to them, which is fair enough. Comparing crime rates between municipalities picks up differences in reporting practice, in demographics and in what each police service prioritises, not just differences in crime.
A police force of its own, and what that buys
Most British Columbia municipalities are policed by an RCMP detachment. Twelve have their own force, and New Westminster is one of them, at 555 Columbia Street, governed by a police board that publishes its meeting packages.
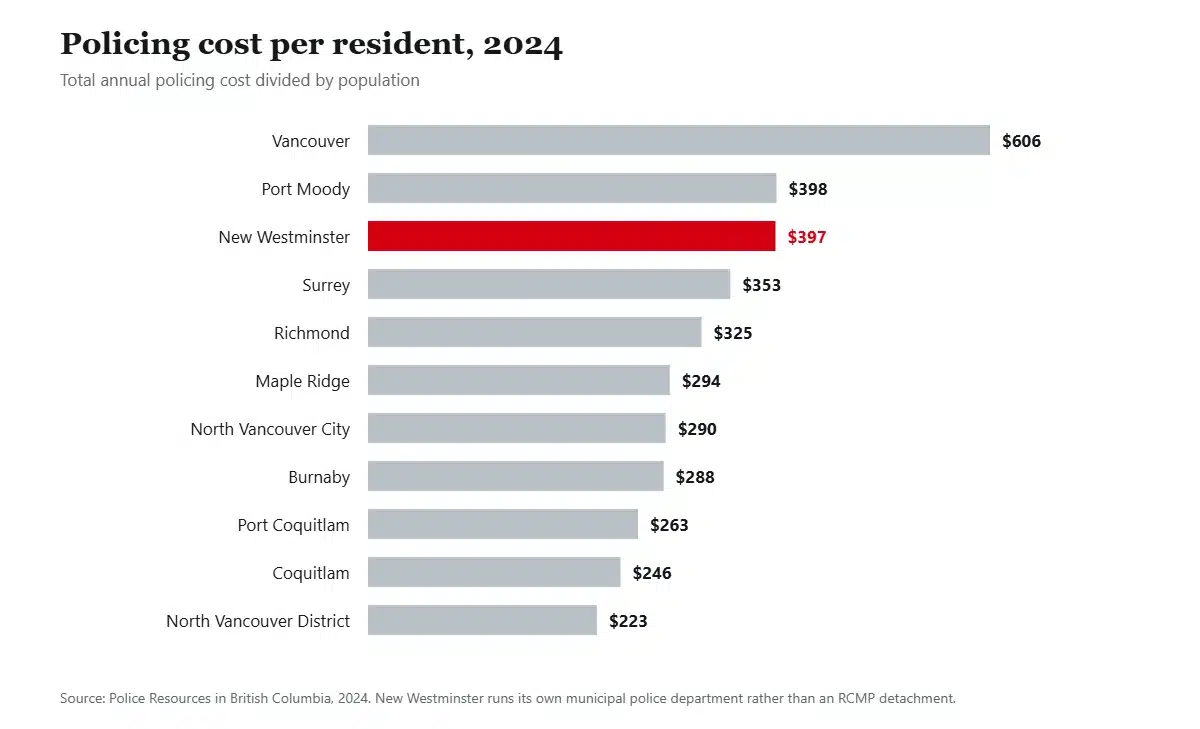
The cost is $36.7 million a year, or $397 per resident, which is second only to Vancouver in our comparison set and effectively level with Port Moody. What Port Moody gets for the same money is 714 residents per officer and a caseload of 21 files each. New Westminster gets 783 residents per officer and 48 files each.
Its own police board describes that 783 as the highest among British Columbia’s municipal police agencies, against a provincial average of 585. So the city pays near the top of the range per resident and its officers still carry one of the heavier workloads. Both things are true at once, and neither gets mentioned in the usual comparisons.
A decade of numbers, and the trap in them
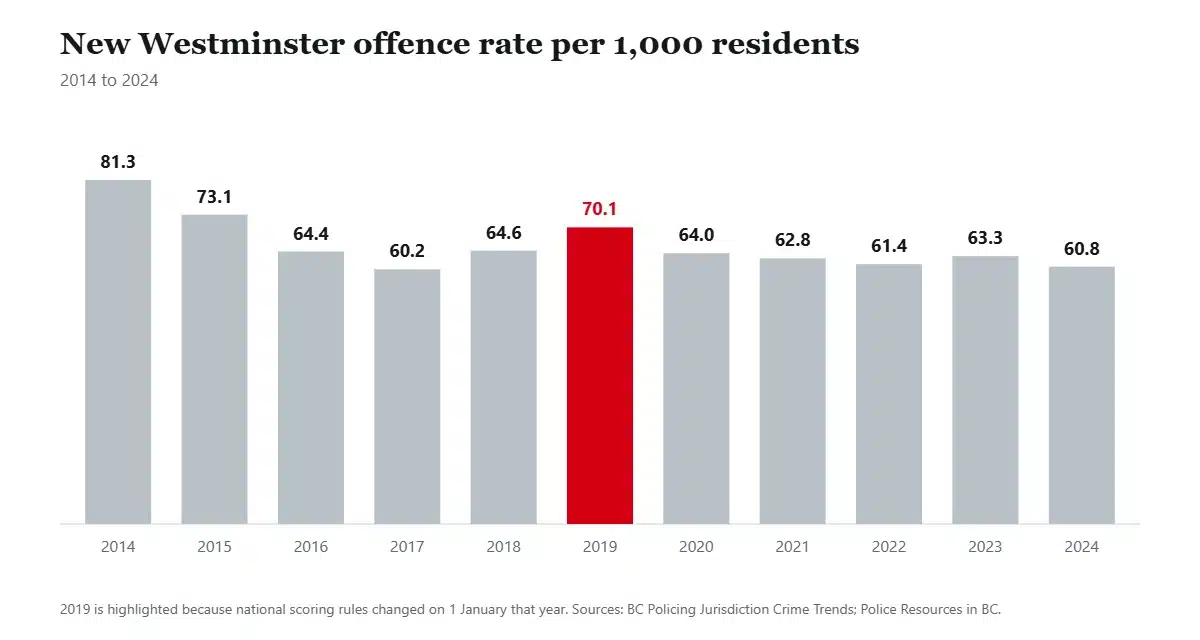
The rate fell hard from 2014 to 2017, from 81.3 to 60.2. It rose again to 70.1 in 2019 and has drifted down since. Today’s 60.8 is the second lowest figure in the eleven years, and the population grew from about 71,500 to 92,400 over the same period.
Now the part almost every safest-cities article skips. Violent offence counts jumped from 737 in 2018 to 1,181 in 2019, a 60 per cent rise in a single year, while property offences over the same year moved 4 per cent. Cities do not experience a 60 per cent surge in violence with property crime flat.
What happened on 1 January 2019 is that new national scoring rules and a provincial recording policy change took effect, and more incidents began to be categorised as founded. The province says so in the report itself and warns against comparing across that date. Any claim that violent crime in a BC city is up some large percentage since 2018 is carrying that change inside it.
One thing we are not going to print: the year-by-year property crime counts in the provincial appendix. When we checked them against the totals, the residual landed on exactly 1,000 in eight years out of ten, which is not something real data does. Something in that series has been reconstructed rather than read. The totals are sound and match the separately published 2024 figure, so those are what appear above.
Severity, and why you will see two different numbers
Crime rate counts every offence equally. The Crime Severity Index weights them, so a homicide moves it far more than a stolen bicycle.
New Westminster Police reported a 2024 index of 79.5 in July 2025, calling it a six-year low, with total severity down 16.9 per cent, violent severity down 23.3 per cent and no homicides recorded that year. Statistics Canada’s release a year later puts 2024 at 83.6 and 2025 at 83.9, essentially flat.
Both are defensible. Statistics Canada revises these values when it recalculates offence weights, so a number published for 2024 in one year can differ from the number published for 2024 the next. The honest version is to say which release you are quoting. On the newer figures, New Westminster’s 83.9 sits a shade above the Vancouver census metropolitan area at 83.5 and well above the national 75.0.
What the police department actually tracks
New Westminster Police publish a set of offences they monitor themselves, which is more useful than an index because you can picture it.
| Monitored offences | 2022 | 2023 | 2024 |
|---|---|---|---|
| Theft from vehicle | 704 | 561 | 397 |
| Domestic violence | 634 | 588 | 530 |
| Impaired driving | — | 207 | 100 |
| Break and enter, businesses (downtown core) | — | 65 | 27 |
| Robberies (downtown core) | — | 42 | 18 |
| Homicides and attempts | — | — | 0 |
Source: New Westminster Police Department, 2024 crime statistics release, February 2025. The department notes these are the offences it actively monitors, not a complete picture of all crime.
Thefts from vehicles fell 44 per cent in two years, and that is the offence most people moving into a dense city actually worry about, and the direction is good. Note the last four rows are downtown-core figures rather than citywide, so do not repeat them as a whole-city number.
The downtown work behind those figures is worth describing accurately. An enhanced foot patrol ran through spring to autumn 2025: roughly 3,200 hours, more than 70 proactive arrests, about 250 files generated on view, and more than a thousand wellness checks and referrals. Fourteen times more social-service contact than arrests, which is what downtown enforcement in New Westminster consists of.
The SkyTrain question
New Westminster has five SkyTrain stations inside 15.6 square kilometres, all of them on the Expo Line: 22nd Street, New Westminster, Columbia, Sapperton and Braid. For a city this size that is a remarkable amount of rapid transit, and it is the thing people ask about.
Here is the honest answer. No police service publishes crime statistics by station. Metro Vancouver Transit Police’s 2025 report to the community contains no station, line or municipality breakdown, and does not mention New Westminster anywhere. Anyone giving you a figure for Columbia Station is making it up.
What exists is the system-wide picture. Across 404.2 million boarded passengers in 2025, Transit Police recorded 1,458 crimes against persons and 1,454 against property, which works out at about 0.36 crimes against persons per 100,000 boardings.
The risk the police are actually worried about
In its February 2026 board package, the department reported violent crime down and flagged something else: 19 collisions involving vulnerable road users since 1 November 2025, 16 of them pedestrians.
That fits the city. New Westminster is the second densest municipality in the country after Vancouver, at 5,052 people per square kilometre on the 2021 census, which puts it ahead of Toronto and Montreal. The place is built on a hill, it is walkable, and it has traffic funnelling through it from three directions. If you are moving here with children or without a car, traffic is the live risk, not crime.
On that note, the interchange at Brunette Avenue and Highway 1 recorded 331 crashes in 2024, fourth worst in the Lower Mainland. It sits on the boundary with Coquitlam and is a provincial highway interchange rather than a city street, but it is the one you will be using.
Two things that changed recently
The Pattullo Bridge is gone. Its replacement, the stal̕əw̓asəm Bridge, opened all four lanes on 14 February 2026, with wider lanes, a centre median and barrier-separated walking and cycling lanes. Anything you read invoking the old Pattullo’s reputation is now describing a bridge that is being demolished. That demolition runs about two years, so expect disruption at the Columbia Street end of the corridor into 2028.
And Royal Columbian Hospital finished the largest piece of its redevelopment. Fraser Health calls it BC’s oldest hospital and one of its busiest, and the only hospital in the province with trauma, cardiac care, neurosurgery, high-risk obstetrics, neonatal intensive care and acute mental health services on one site, serving more than two million people across 20 communities. A hospital of that reach inside a city of 92,000 means a lot of people are in New Westminster on any given day who do not live there. That is worth understanding when you read a rate that divides offences by residents.
Flooding, which is the more measurable risk
About 5 of the city’s 12 square kilometres sit inside the provincial floodplain, which is roughly 42 per cent of it. That covers parts of the mainland and all of Queensborough, which is physically on Lulu Island across the river and sits behind a perimeter dyke built in the 1960s protecting around 350 hectares.
Major freshets hit in 1894, 1948 and 1972. The city monitors snowpack and river conditions through the provincial river forecast centre and adopted a flood resilience plan in 2022. We are not going to give you a flood probability, because the city does not publish one. Check the address against the floodplain map before you sign anything.
Frequently asked questions
Is New Westminster safe to live in?
About as safe, on the published numbers, as Vancouver and safer than Maple Ridge or the City of North Vancouver, with a rate that has fallen roughly a quarter in a decade. It is a dense urban municipality, so it has urban property crime, and theft from vehicles is the offence you are most likely to meet.
Which part of New Westminster is safest?
Nobody can tell you honestly. Its police department publishes some downtown-core figures and nothing else by geography, and no neighbourhood-level crime data for New Westminster exists anywhere. Any neighbourhood safety ranking you find was invented.
Why do some sites say New Westminster’s crime rate is over 70?
Because they divided the offence count by the 2021 census population instead of the BC Stats estimate the province actually uses. That inflates the rate by about 17 per cent. The province publishes 5,623 offences against a population of 92,435, which is 60.8 per 1,000.
Is the SkyTrain safe in New Westminster?
No station-level data exists to answer that, from Transit Police or anyone else. System-wide across the whole network in 2025 there were 1,458 crimes against persons against 404.2 million boardings.
Does New Westminster have its own police?
Yes, one of twelve municipalities in British Columbia with an independent municipal police department rather than an RCMP detachment, at $397 per resident a year.
How we put this together
Figures come from the Province of British Columbia, the New Westminster Police Department’s own annual report and board packages, Statistics Canada, Metro Vancouver Transit Police, ICBC and the City of New Westminster, linked where they appear.
Four cautions we would rather print than bury. The 2019 scoring change makes figures either side of that date incomparable, and we have said so where it matters. Nor have we published the provincial appendix’s property crime series, because it fails an internal arithmetic check. We have not called Royal Columbian a level one trauma centre, because Fraser Health does not use that wording on its own page, and we have used its description instead. And we have not connected supportive housing to crime in either direction, because no published data supports a claim either way.
Sources
- BC Ministry of Public Safety and Solicitor General, Police Resources in British Columbia, 2024
- BC Policing Jurisdiction Crime Trends, 2014 to 2023, Appendix D
- New Westminster Police Department, 2024 annual report
- New Westminster Police Department, 2024 crime statistics
- New Westminster Police Department, Crime Severity Index six-year low
- Statistics Canada, Crime Severity Index by census metropolitan area, 2025
- Metro Vancouver Transit Police, reports to the community
- TransLink, SkyTrain lines and stations
- Province of British Columbia, stal̕əw̓asəm Bridge opening, February 2026
- Fraser Health, Royal Columbian Hospital redevelopment
- City of New Westminster, flood management
- ICBC, ten-year auto crime data, May 2026
Weighing up a particular part of the city? Our area guide covers what each neighbourhood is actually like, the cost breakdown deals with the question most people ask next, and the wider case for and against weighs the whole thing up. When you have settled on an address, tell us where you are moving from.
