

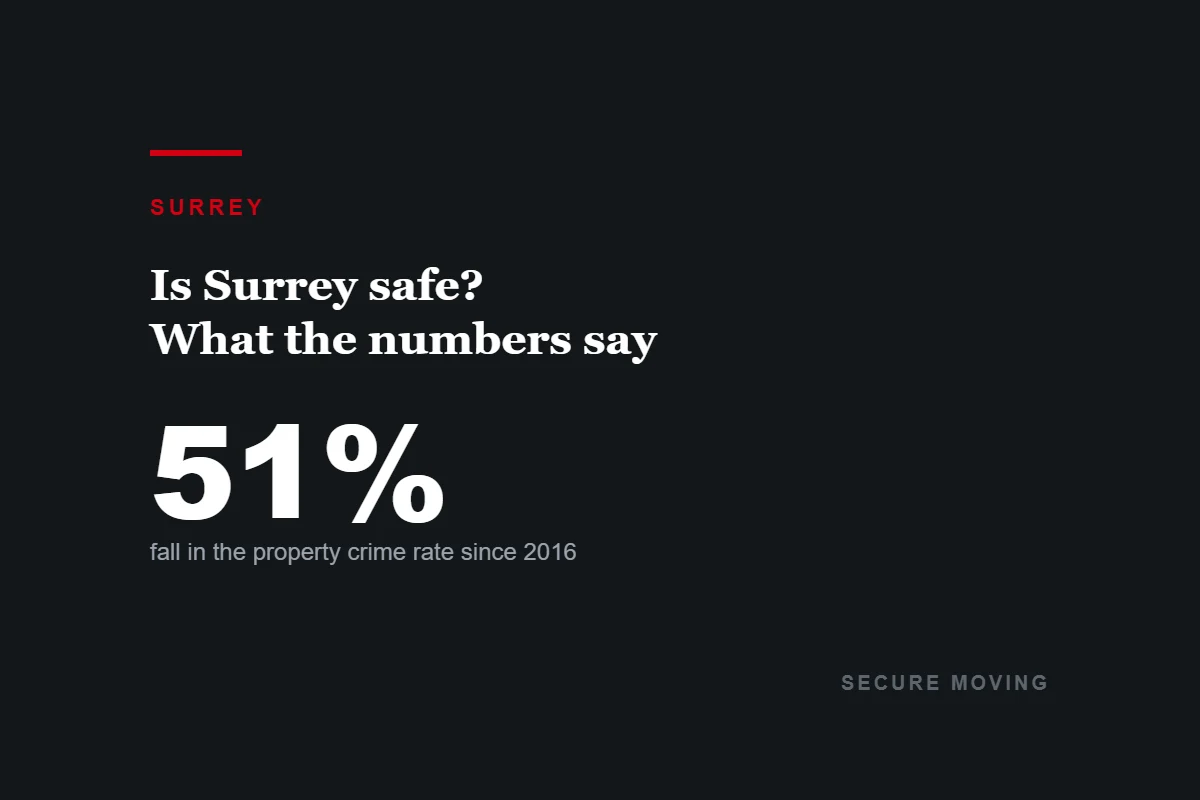
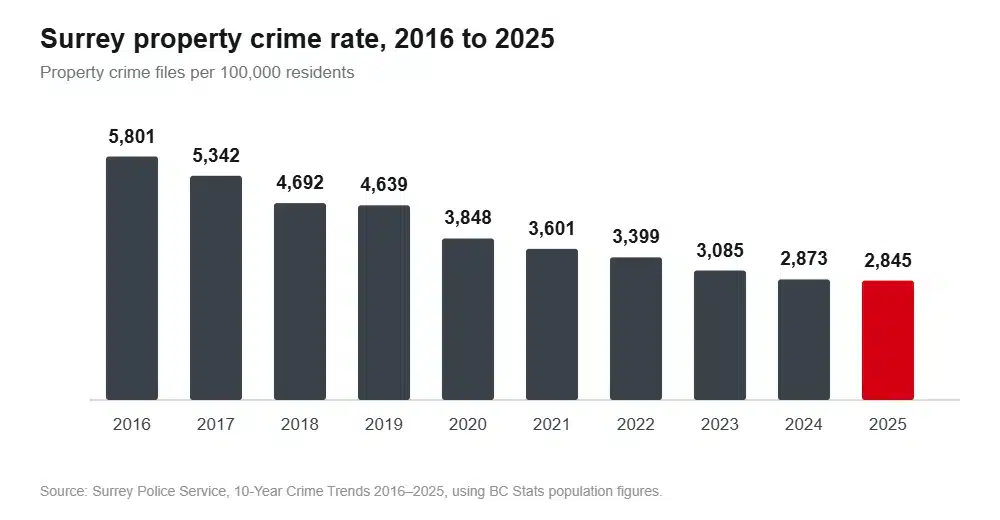
Surrey’s property crime rate has fallen every single year since 2016, from 5,801 offences per 100,000 residents down to 2,845. A 51 per cent drop over a decade, and it happened while the city added more than 130,000 people.
Surrey also recorded 13 homicides in the first seven months of 2026, against six in the whole of 2025.
Both of those are true, both come from the same police force, and any guide that gives you only one of them is selling you something. Below is the full picture, including the thing almost nobody explains: Surrey changed police forces partway through this data, and it makes the year-over-year numbers harder to read than they look.
First, the thing that breaks most Surrey crime statistics
On 29 November 2024, the Surrey Police Service became the police of jurisdiction for Surrey, ending 73 years of RCMP policing. The handover was not a switch flipped overnight. It has run district by district:
- November 2024: Whalley/City Centre and Newton
- November 2025: South Surrey
- April 2026: Cloverdale, ending 75 years of RCMP policing there
- Guildford and Fleetwood: still RCMP-policed as of the most recent confirmed update in mid-2026, with no announced handover date
Every statistics report SPS publishes now carries this warning, and it is worth reading in full:
On 2024-11-29, Surrey Police Service became the police of jurisdiction for the City of Surrey; from this date, Surrey policing statistics combine data from the Surrey Police Service and the Surrey RCMP… Data should be interpreted with caution due to different organizational policies and data protocols between agencies.
So what does that mean for you? Any comparison that crosses late 2024 crosses an agency boundary and a records-system boundary. SPS also noted that some transferred files produced duplicate reports. None of this makes the numbers fake. But a headline like “violent crime up 23 per cent” carries a footnote the police themselves insist on, and that footnote rarely survives into a news headline.
Read the long trend with confidence. Read single-year jumps around 2024 and 2025 with care.
The ten-year trend
SPS publishes a decade of rates per 100,000 residents, which is the right way to look at a city growing this fast.
| Year | Persons crime rate | Property crime rate | Overall crime rate |
|---|---|---|---|
| 2016 | 1,089 | 5,801 | 8,759 |
| 2017 | 971 | 5,342 | 7,926 |
| 2018 | 940 | 4,692 | 7,489 |
| 2019 | 1,360 | 4,639 | 7,747 |
| 2020 | 1,208 | 3,848 | 6,603 |
| 2021 | 1,159 | 3,601 | 6,527 |
| 2022 | 1,015 | 3,399 | 6,012 |
| 2023 | 935 | 3,085 | 5,762 |
| 2024 | 836 | 2,873 | 4,944 |
| 2025 | 992 | 2,845 | 5,287 |
Rates per 100,000 residents. Source: Surrey Police Service, 10-Year Crime Trends 2016–2025, using BC Stats population figures.
Property crime is the honest headline here. Rates dropped in every one of the last nine years, through two police forces, a pandemic and a population boom. That is the crime type most residents actually encounter, and in Surrey it is now roughly half what it was a decade ago.
Violence is a more complicated line. It fell steadily to a low of 836 per 100,000 in 2024, then rose to 992 in 2025. Even after that rise, 2025 sat below every year from 2016 to 2021.
2025 in detail
| Offence | 2024 | 2025 | Change |
|---|---|---|---|
| Homicide | 10 | 6 | −40% |
| Assault | 2,942 | 3,614 | +23% |
| Robbery | 335 | 402 | +20% |
| Sexual assault and interference | 447 | 489 | +9% |
| Extortion | 12 | 133 | +1,008% |
| Residential break and enter | 515 | 448 | −13% |
| Business break and enter | 463 | 544 | +17% |
| Theft from a vehicle | 3,251 | 3,118 | −4% |
| Theft of a vehicle | 981 | 1,021 | +4% |
| Mischief | 3,023 | 3,002 | −1% |
| Total calls for service | 189,315 | 182,568 | −4% |
Source: SPS Crime Statistics Report, December 2025. SPS does not publish shoplifting or weapons offences as separate lines.
2026 so far, told straight
The first seven months of 2026 are worse, and pretending otherwise would be useless to anyone deciding where to live.
| January to July | 2025 | 2026 | Change |
|---|---|---|---|
| All crimes against persons | 4,025 | 4,967 | +23% |
| Homicide | 5 | 13 | +160% |
| Extortion | 29 | 138 | +376% |
| Assault | 1,987 | 2,387 | +20% |
| All property crimes | 12,148 | 12,931 | +6% |
| Residential break and enter | 274 | 251 | −8% |
| Theft of a vehicle | 616 | 536 | −13% |
| Total calls for service | 106,105 | 102,626 | −3% |
Source: SPS Crime Statistics Report, July 2026.
Notice what is not rising. Residential break-ins are down. Car theft is down. Total calls for service are down. The increase is concentrated in violence against people, and one category in particular is doing most of the work.
The extortion story explains a lot of 2026
Extortion reports went from 12 in 2024 to 133 in 2025 to 138 in the first seven months of 2026. These are largely a series of threats and property shootings targeting South Asian business owners, and it has been the dominant policing story in Surrey for two years.
The shots-fired data shows the pattern clearly:
| Year | Confirmed shots fired | Persons shot | Firearm homicides |
|---|---|---|---|
| 2021 | 50 | 29 | 6 |
| 2022 | 62 | 37 | 13 |
| 2023 | 43 | 15 | 6 |
| 2024 | 38 | 18 | 3 |
| 2025 | 86 | 16 | 5 |
Source: Shots Fired 2015 to 2025, Surrey RCMP and Surrey Police Service. The document cautions that collection methodology may not be consistent year to year.
Shootings more than doubled in 2025 while the number of people shot went down, from 18 to 16. Taken together these were overwhelmingly shots at buildings and vehicles rather than at people: intimidation, not the gang conflict pattern of 2022, when 62 shootings produced 37 casualties and 13 firearm homicides.
SPS redeployed more than 40 officers to dedicated extortion teams, and by mid-2026 reported a decline in both extortion threats and extortion-related shootings over the preceding four months.
How Surrey compares
This is where the reputation and the record part company.
Weighting offences by how serious they are gives you the Crime Severity Index. Surrey’s has been below both the provincial figure and Vancouver’s every year since 2021:
| Year | Surrey | British Columbia | Vancouver |
|---|---|---|---|
| 2020 | 94.49 | 90.91 | 99.27 |
| 2021 | 87.85 | 95.42 | 98.83 |
| 2022 | 90.94 | 101.28 | 105.75 |
| 2023 | 78.74 | 97.40 | 102.01 |
| 2024 | 79.35 | 94.13 | 96.40 |
Statistics Canada Crime Severity Index, as reproduced by SPS in its 10-Year Crime Trends. Police-service level, so Vancouver here means the City of Vancouver, not the metro area.
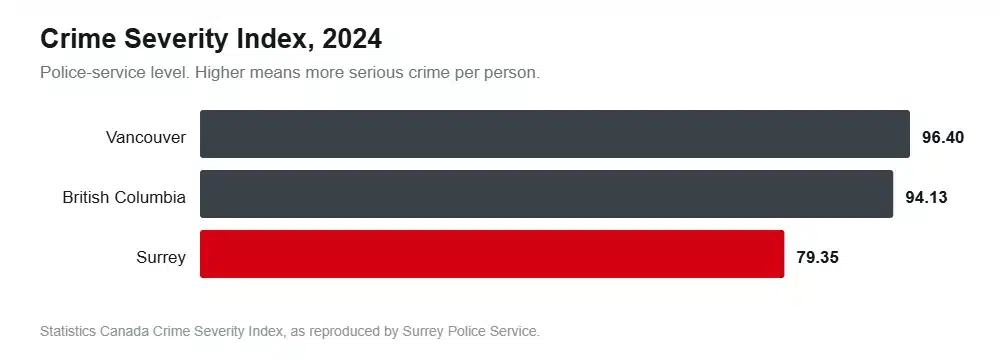
In 2024 Surrey’s CSI of 79.35 was 16 per cent below the provincial figure and 18 per cent below Vancouver’s.
The province’s Police Resources in British Columbia, 2024 tells the same story a different way. Working from its own offence and population columns, Surrey recorded 36,795 Criminal Code offences among 700,541 residents, which works out to 52.5 per 1,000. Against its neighbours:
| Municipality | Offences per 1,000 | Policing cost per resident |
|---|---|---|
| Coquitlam | 43.2 | $246 |
| Surrey | 52.5 | $353 |
| Abbotsford | 55.1 | $411 |
| Richmond | 56.8 | $325 |
| Burnaby | 57.2 | $288 |
| Vancouver | 60.4 | $606 |
| New Westminster | 60.8 | $397 |
| Langley City | 103.4 | $497 |
Surrey has a lower Criminal Code crime rate than Vancouver, Burnaby, Richmond, Abbotsford and New Westminster, and it polices at $353 a head against Vancouver’s $606. The report itself cautions against reading too much into cross-jurisdiction comparisons, and that caution is fair. But the claim that Surrey is the crime capital of British Columbia does not survive contact with the province’s own table.
Where crime happens in Surrey
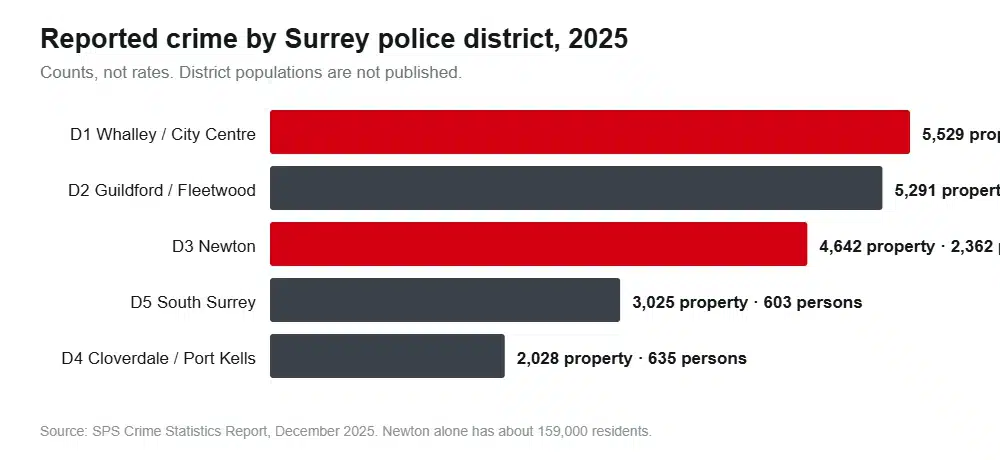
Surrey policing is organised into five districts. Here is the full year 2025:
| District | Persons crimes | Property crimes | Calls for service |
|---|---|---|---|
| D1 Whalley / City Centre | 2,287 | 5,529 | 49,661 |
| D2 Guildford / Fleetwood | 1,232 | 5,291 | 36,003 |
| D3 Newton | 2,362 | 4,642 | 54,379 |
| D4 Cloverdale / Port Kells | 635 | 2,028 | 17,819 |
| D5 South Surrey | 603 | 3,025 | 21,513 |
Source: SPS Crime Statistics Report, December 2025.
Those are counts, not rates, and that distinction matters more in Surrey than almost anywhere. District populations are not published. Newton alone holds about 159,000 people, more than twice Cloverdale’s population, so its higher counts partly reflect the fact that far more people live there. You cannot work out which district is riskiest per person from this table, and anyone who tells you they have is guessing.
What the table does support: Cloverdale and South Surrey report the fewest crimes against persons by a wide margin, roughly a quarter of what Whalley or Newton report. Guildford and Fleetwood sit in the middle on violence but second-highest on property crime.
What nobody publishes, and why that matters
There is no official crime rate, crime severity index or per-capita statistic for Whalley, Newton, Guildford, Fleetwood, Cloverdale or South Surrey individually. The five-district split above is the finest geography any police or government source publishes for Surrey.
Which means every “safest neighbourhoods in Surrey” ranking and every “Whalley crime rate” figure you find online was produced by a commercial estimation model, a real-estate marketing site or a scraped map, not by police. Treat those the way you would treat a stranger’s opinion, because that is closer to what they are.
The City does run a public crime map, COSMOS. Worth knowing before you use it: it covers the last six months and only five property offences (business and residential break-ins, shoplifting, theft from vehicle, vehicle theft). Assaults, shootings and homicides are not mapped at all, so it tells you nothing about violence.
The gap between how Surrey feels and what happens
The Surrey Police Board commissioned a proper survey on exactly this: 1,000 Surrey adults, weighted to census demographics, margin of error 3.4 points. The findings are the most useful thing in this whole guide.
- 83 per cent of residents reported no crime victimisation at all in the previous year.
- 91 per cent named violent crime a top policing priority, though violent offences were only about 20 per cent of recorded crime. Property crime, at 55 per cent of offences, was named by 61 per cent.
- In Whalley, 59 per cent felt unsafe walking alone at night. During the day, 14 per cent.
- Citywide, 52 per cent of women felt unsafe at night against 9 per cent of men.
- Self-reported victimisation ran from 27 per cent in Whalley down to 9 per cent in Cloverdale.
Look at the Whalley numbers again. A fourfold gap between night and day in the same neighbourhood says the fear is about specific situations, not about the place in general. Far more useful to know than any crime score.
So, is Surrey safe?
For most people, in most of the city, most of the time: yes, and the long-run data says it is getting safer rather than worse. The property crime rate has halved in a decade. The crime severity index sits below the provincial average and below Vancouver’s. Five out of six residents go a whole year without being a victim of anything.
Now the qualifications: 2025 and 2026 have seen a real, specific rise in violence, driven substantially by an extortion campaign that police are actively working. Whalley and Newton carry the highest volume of reported crime. And the numbers around the police transition need reading with the care that SPS itself asks for.
If you are choosing between neighbourhoods, the district table and the survey together tell you more than any ranking will. Then go and walk the blocks, in the evening as well as at lunchtime.
Frequently asked questions
Is Whalley safe?
District 1, which covers Whalley and Surrey City Centre, reported 2,287 crimes against persons and 5,529 property crimes in 2025, the highest property total of any district. It also had the highest self-reported victimisation in the police board’s survey at 27 per cent, and the sharpest day-night divide: 14 per cent of residents felt unsafe during the day against 59 per cent at night. It is Surrey’s densest, busiest, most transit-served area and carries the volume that goes with that.
Is Newton safe?
District 3 recorded the highest crimes-against-persons count in 2025 at 2,362, marginally above Whalley, and the most calls for service. Newton is also Surrey’s most populous community with about 159,000 residents, roughly 28 per cent of the city, so a high count is partly a function of size. No per-capita figure is published, so a direct safety ranking against other districts is not possible from official data.
What is the safest part of Surrey?
By reported counts, Cloverdale and South Surrey. Cloverdale logged 635 crimes against persons in 2025 and South Surrey 603, against more than 2,200 in each of Whalley and Newton. Cloverdale also had the lowest self-reported victimisation in the police board survey at 9 per cent. Both are lower-density, higher-income and further from the city centre.
Is Surrey more dangerous than Vancouver?
Not on the standard measures. Surrey’s 2024 crime severity index of 79.35 was below Vancouver’s 96.40, and its Criminal Code offence rate of 52.5 per 1,000 was below Vancouver’s 60.4. We go through the Vancouver figures in the same detail separately.
Is Surrey’s crime rate going up or down?
Both, depending on the offence. Property offences have fallen every year since 2016, to roughly half the 2016 rate. Crimes against people fell until 2024 and have risen since, sharply so in 2026, driven largely by extortion and assault.
How we put this together
Every figure comes from the Surrey Police Service, the City of Surrey, the Province of British Columbia or Statistics Canada, linked where it appears. We have not calculated neighbourhood crime rates, because the population data needed to do it honestly is not published.
Three cautions we would rather state than bury. Surrey’s 52.5 offences per 1,000 is calculated from the province’s own offence and population columns; the report itself prints the rate rounded to 53. Homicide counts differ slightly between SPS publications for 2022 and 2024, so we have used the December 2025 report consistently. And police-reported crime measures what gets reported: extortion in particular is widely believed to be under-reported, which cuts against the trend shown here rather than for it.
Sources
- SPS, Surrey 10-Year Crime Trends 2016–2025
- SPS Crime Statistics Report, December 2025
- SPS Crime Statistics Report, July 2026
- Shots Fired 2015 to 2025
- Surrey Community Survey, Surrey Police Board
- SPS, Policing Transition
- SPS, Crime Maps & Stats
- BC Ministry of Public Safety, Police Resources in British Columbia, 2024
- Statistics Canada, Police-reported crime statistics in Canada, 2025
Settled on an area? We go community by community on price and transit in the neighbourhood guide, and the wider case for and against Surrey covers schools, jobs and healthcare. We move people into and out of every part of the city and can usually tell you what the building access is like before we arrive.
